


Think coffee is the reason you’re crashing?
Often it’s what you eat, not the cup, that sends your day on a rollercoaster.
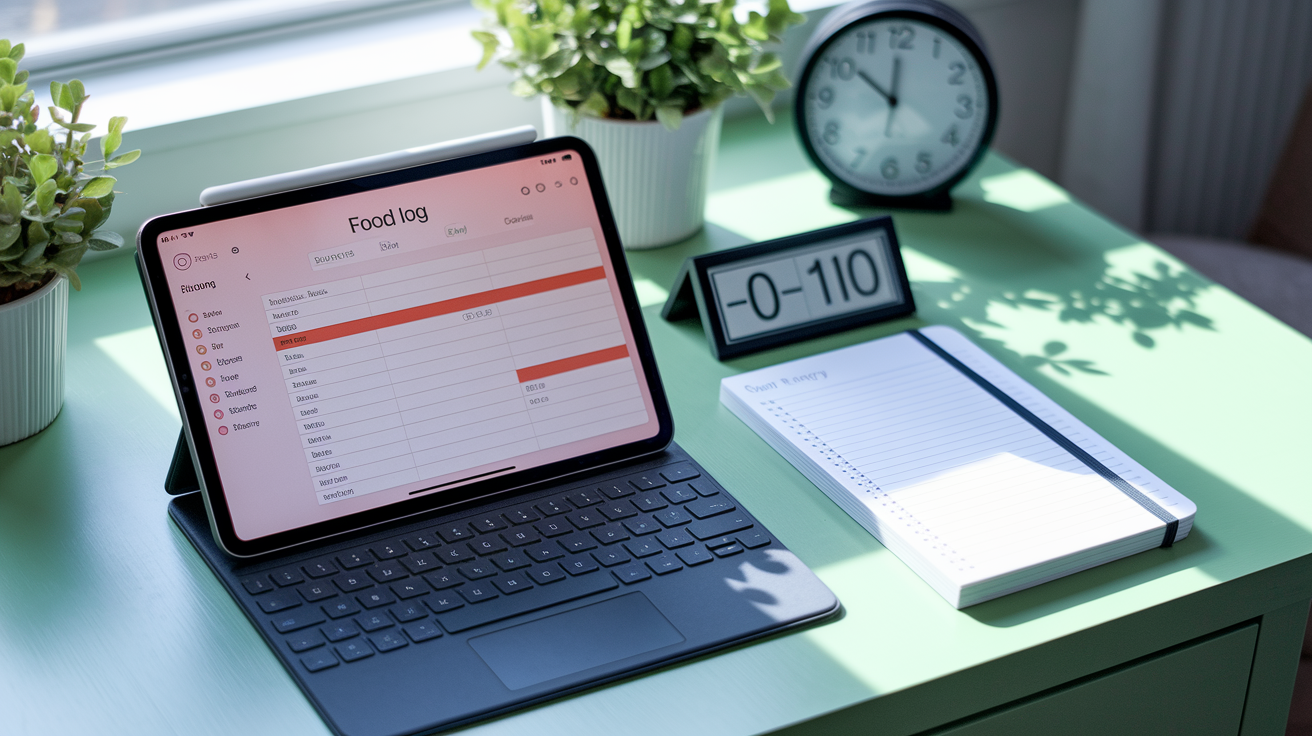
This post gives a plain three-part system: a quick food log, a 1 to 10 energy check at set times, and short context notes so you can link exact meals to real shifts in alertness.
Do this for a week or two and you’ll see which breakfasts, lunches, or snacks lift you, and which ones leave you foggy or hungry two hours later.
It’s a fast way to turn clues into action.
Practical System for Tracking Nutrition’s Direct Impact on Daily Energy
You need a simple tracking system that captures what you eat and what you feel. The goal? Connect specific meals to changes in your energy so patterns show up fast.
Your system needs three parts: a food log, an energy rating scale, and timing checkpoints. Food logs record what you ate, how much, and rough macronutrient counts. Energy ratings use a 1 to 10 scale checked at consistent times. Before each meal, 30 to 60 minutes after eating, 2 to 3 hours later, and again at bedtime. Context notes round things out by capturing sleep hours, hydration in milliliters, stress level on a 1 to 10 scale, and any caffeine or supplements.
A single log entry might look like this: “08:00, 1 cup oats (80 g), 200 mL milk, 1 banana; protein 12 g / carbs 60 g / fat 8 g; hydration 300 mL; energy pre meal 6 → 1h = 7 → 3h = 5.” That format lets you see whether a meal gave you a lift, kept you steady, or led to a crash hours later. Two meals with the same calorie count can produce completely different energy outcomes. Peanut butter on whole grain bread (fiber, protein, healthy fats) often keeps energy stable for hours, while an iced doughnut with the same 240 calories typically causes a spike followed by a slump.
Patterns start showing up within hours when you watch for blood sugar swings. But meaningful trends emerge across days and weeks as you track fullness, cravings, and overall daily energy. Larger shifts in weight, lipid panels, and metabolic markers usually take months to confirm, so early tracking focuses on day to day correlations you can test and adjust right away.
Six Steps to Set Up Your Tracking System
- Pick one logging method (digital app, spreadsheet, or notebook) and commit to it for at least two weeks.
- Write down baseline energy and diet metrics on day one: sleep hours, typical stress level, current energy rating, usual meal times, and water intake.
- Log every meal and snack with time, portion size, and estimated protein, carbs, fat, fiber, and added sugar grams.
- Record energy ratings on a 1 to 10 scale immediately before eating, then 1 hour and 3 hours after each meal, and once more before bed.
- Add quick context notes each day. Caffeine milligrams, hydration milliliters, sleep hours, and any big stressors or exercise sessions.
- Review each week by comparing average energy scores across meals and spotting which foods consistently lift or drain your energy.
Core Nutrition Metrics to Track for Understanding Energy Changes
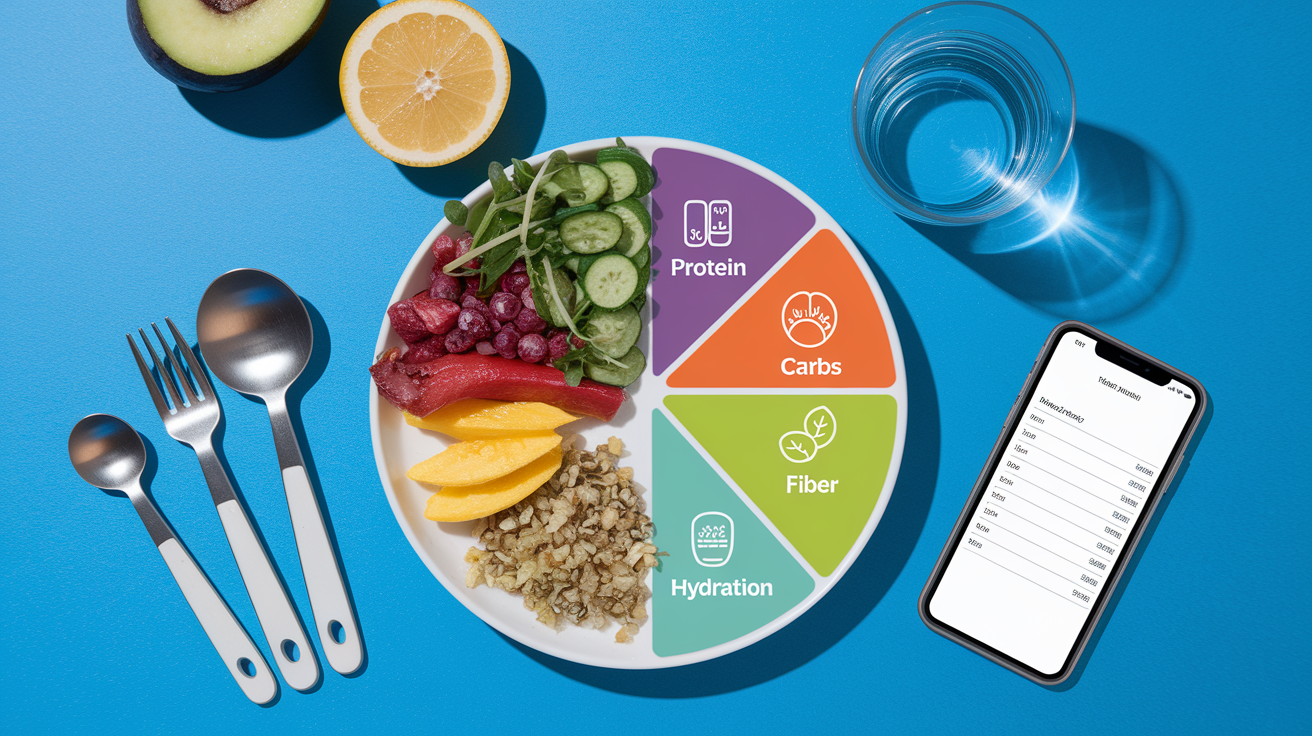
Not every nutrient affects energy the same way. Track the ones most likely to shift your alertness, steadiness, and recovery so you can test changes that actually matter.
Start with total calories to confirm you’re meeting your baseline energy needs, then move to macronutrients (grams of protein, carbohydrate, and fat). Protein and fat help smooth blood sugar curves and prolong fullness, while carbohydrates have the biggest immediate impact on energy. Separate carbohydrate quality by logging servings of whole grains, vegetables, and legumes versus refined grains and added sugars. Fiber grams show up as a dedicated line because fiber slows digestion and steadies blood sugar, preventing the spikes and crashes that leave you foggy. Hydration in milliliters matters too. Even mild dehydration increases fatigue and drops mental performance.
Beyond macros, log specific food groups: servings of vegetables, whole grains, healthy fats (olive oil, nuts, seeds), and items to watch like red meat and fried foods. Whole grains such as oats, quinoa, and brown rice deliver fiber, protein, and fat together, releasing glucose slowly and keeping energy steady across hours. Refined carbs like white bread and sugary drinks hit fast, drive insulin high, then drop you into a crash. Tracking carbohydrate type directly shows which meals give sustained energy and which ones set you up for a midmorning or afternoon slump.
Five Nutrition Metrics with the Biggest Energy Impact
Protein grams per meal. Stabilizes blood sugar, supports fullness, and prevents energy dips between meals.
Fiber grams daily. Slows carbohydrate absorption and smooths glucose curves, reducing crashes.
Added sugar grams. High amounts trigger insulin spikes followed by sharp energy drops within 1 to 3 hours.
Whole grain and vegetable servings. Provide steady release carbs, vitamins, and minerals that support sustained alertness.
Hydration milliliters. Tracks fluid intake to catch dehydration, a common and fixable cause of fatigue.
Logging Energy Levels Throughout the Day for Pattern Recognition

Tracking energy at consistent checkpoints each day reveals when your body responds well to food and when it struggles. Record a 1 to 10 energy rating before every meal to establish your baseline, then check again 1 hour after eating to catch the immediate response, and once more 3 hours later to spot delayed effects like crashes or sustained steadiness. Add a final bedtime rating to see how the whole day’s eating patterns influence nighttime energy and readiness for sleep.
Context notes turn raw energy numbers into useful patterns. Jot down hours of sleep the night before, caffeine intake in milligrams, stress level on a 1 to 10 scale, and any exercise or major events. These variables help you distinguish whether low energy came from a poor meal choice, bad sleep, too much caffeine wearing off, or something else entirely. Apps like Cronometer let you chart your energy rating against specific nutrients (carbs, caffeine, or fiber) so correlations jump out when you review a week of data.
Combine your ratings with simple symptom tracking: note moments of jitteriness, brain fog, hunger spikes, or unusual cravings. These clues often point to blood sugar swings or nutrient imbalances before they show up in lab tests. After two weeks of consistent logging, compare average pre meal and post meal energy scores across different meal types to identify which breakfasts, lunches, or dinners consistently boost or drain you.
| Time Check | Purpose | What to Record |
|---|---|---|
| Pre meal (baseline) | Capture your starting energy before food influences it | Energy rating 1 to 10, hunger level, any fatigue or brain fog |
| 1 hour post meal | Detect immediate blood sugar response and initial alertness shift | Energy rating 1 to 10, fullness, any jitters or sleepiness |
| 3 hours post meal | Identify delayed crashes or sustained steadiness | Energy rating 1 to 10, cravings, mood, focus quality |
Using Meal Timing and Composition Tracking to Prevent Energy Crashes

When you eat matters almost as much as what you eat. Irregular meal timing and skipped meals both increase fatigue and make it harder to spot food quality effects because hunger and circadian misalignment muddy the signal. Eating at roughly the same times each day stabilizes blood sugar and helps your body anticipate and prepare for digestion. That leads to steadier energy and fewer surprise dips.
Breakfast timing and content have an outsized impact on morning and midday energy. Skipping breakfast or choosing high sugar options sets up a rollercoaster. Insulin spikes, then crashes a few hours later, leaving you foggy and craving more sugar. A balanced breakfast with protein, fiber, and healthy fat (like eggs with oats and avocado) keeps blood sugar steady and energy high until lunch. Track your breakfast time, composition, and the resulting 1 hour and 3 hour energy scores to confirm which morning meals actually carry you through the day versus which ones sabotage your focus by 11 a.m.
Five Meal Timing Factors to Track Each Day
- Time of each meal and snack. Look for consistency across days and note any irregular patterns on low energy days.
- Interval between meals. Long gaps (more than 4 to 5 hours) without food can trigger energy crashes and sugar cravings.
- Breakfast composition. Record grams of protein, fiber, and fat to test which combinations prevent midmorning slumps.
- Late night eating cutoff. Note when your last meal or snack happens and compare sleep quality and next morning energy.
- Carbohydrate timing. Track whether you eat most carbs at breakfast, lunch, or dinner, and correlate with afternoon and evening energy trends.
Tracking Blood Sugar Responses to Food for More Accurate Energy Insights

Blood sugar swings are the most common driver of energy crashes, and tracking them directly removes the guesswork. When you eat refined carbs (white bread, sugary drinks, pastries), glucose spikes fast, insulin floods in, and within an hour or two your blood sugar drops sharply. That leaves you tired, foggy, and craving more carbs. Whole grains, legumes, and meals balanced with protein and fat release glucose slowly, keeping blood sugar in a narrow range and energy steady.
You can track blood sugar responses using a continuous glucose monitor (CGM) if accessible, or with fingerstick checks at key times. Fasting in the morning, then 30 to 60 minutes and 2 to 3 hours after meals. CGMs show you real time curves and make patterns obvious after just a few days, but fingerstick testing works fine if you target the meals you most want to understand. Compare postprandial (after meal) glucose responses across different breakfasts or lunches to see which foods keep you stable and which send your blood sugar on a ride.
| Meal Type | Typical 1 Hour Glucose Response | Typical 3 Hour Response | Energy Pattern |
|---|---|---|---|
| Whole grains + protein + fat (e.g., oats, eggs, nuts) | Mild, gradual rise (110 to 130 mg/dL) | Returns smoothly to baseline (80 to 100 mg/dL) | Steady energy, minimal crash, sustained focus |
| Refined carbs + added sugar (e.g., pastry, juice) | Sharp spike (140 to 180 mg/dL) | Often drops below baseline (60 to 80 mg/dL) | Quick boost then crash, fatigue, cravings return |
| Legumes + vegetables (e.g., lentil soup, salad) | Small, slow rise (100 to 120 mg/dL) | Stable near baseline (85 to 105 mg/dL) | Long lasting energy, minimal hunger, clear thinking |
Gut Health Tracking and Its Role in Sustained Daily Energy

Gut symptoms often signal that your body isn’t absorbing nutrients properly, which directly impacts energy even when your diet looks good on paper. Bloating, irregular bowel movements, and fatigue after specific foods can point to sensitivities (gluten, lactose, FODMAPs) or conditions like small intestinal bacterial overgrowth (SIBO), celiac disease, or inflammatory bowel issues. When digestion is off, nutrient absorption drops, and deficiencies in iron, B vitamins, and magnesium sneak in. All of which drain energy.
Track gut health symptoms alongside your food and energy logs to catch patterns. Note when bloating or discomfort happens, which meals trigger it, and whether certain food groups consistently cause trouble. Adding fermented foods like kefir, sauerkraut, and kimchi introduces beneficial probiotics that support digestion and reduce inflammation. Prebiotic foods (onions, leeks, garlic, oats) feed those good bacteria and improve nutrient absorption over time. Fiber from vegetables, whole grains, and legumes keeps digestion regular and stabilizes blood sugar, preventing the energy dips that come from poor gut motility and erratic nutrient delivery.
Four Gut Symptoms to Track for Energy Correlation
Bloating or gas after meals. May indicate poor digestion, food intolerance, or imbalanced gut bacteria affecting nutrient uptake.
Irregular bowel movements. Constipation or diarrhea disrupts absorption and can signal inflammation or sensitivity.
Fatigue within 1 to 3 hours of eating specific foods. Common with gluten sensitivity, lactose intolerance, or high FODMAP foods.
Skin flares or mood shifts tied to certain meals. Gut inflammation often shows up as skin issues or brain fog before digestive symptoms appear.
Tracking Caffeine, Alcohol, and Hydration for Accurate Energy Correlation
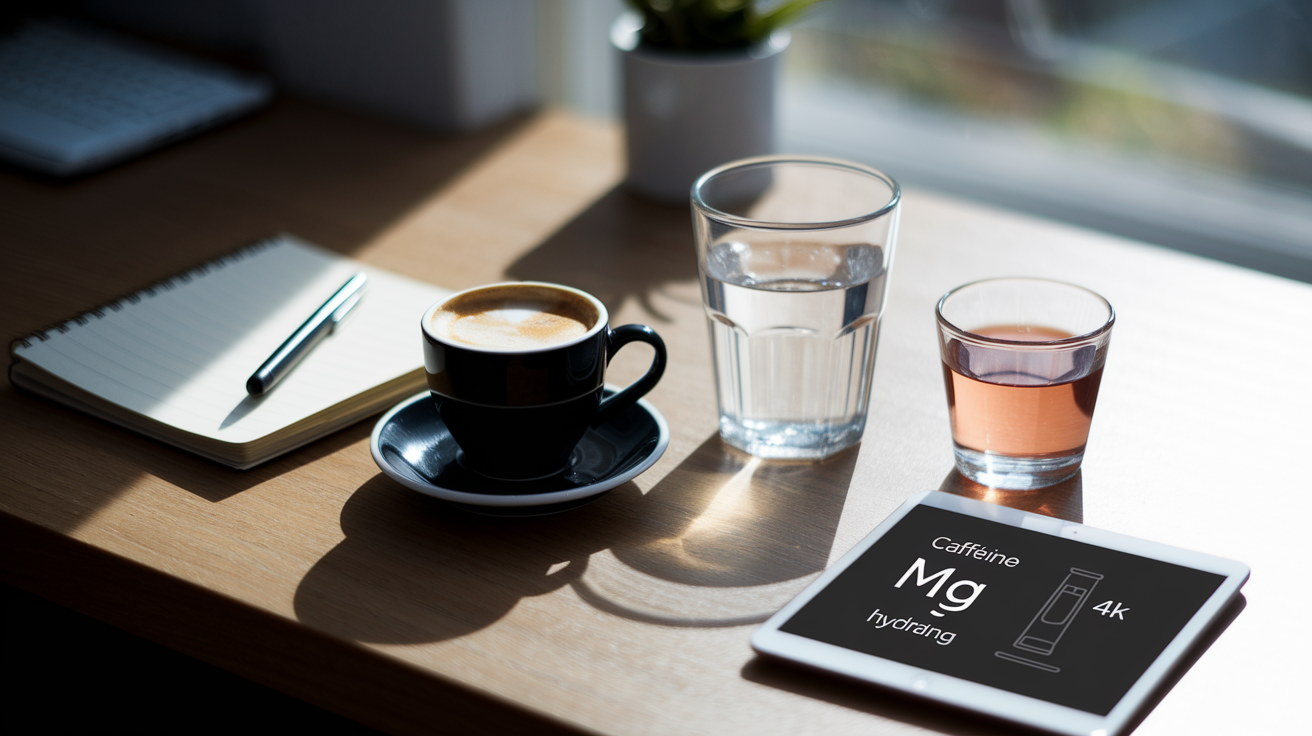
Caffeine, alcohol, and hydration all shift energy in ways that can mask or amplify the effects of food, so logging them separately prevents false conclusions. Caffeine boosts alertness by blocking adenosine receptors in the brain, giving you a temporary lift that peaks within 30 to 60 minutes and fades over the next few hours. Black coffee and green tea deliver that boost with antioxidants and minimal sugar, making them the most stable choices. But when caffeine wears off, the crash can feel like low energy from food when it’s really just the rebound effect.
Alcohol acts as a central nervous system depressant, slowing neural activity and increasing drowsiness both during drinking and the next day. Even moderate intake disrupts sleep architecture, leaving you tired the morning after despite adequate sleep hours. Hydration is one of the most overlooked energy drivers. Mild dehydration as small as 1 to 2 percent of body weight reduces cognitive performance, increases perceived effort, and amplifies fatigue. Track water intake in milliliters each day and compare hydration levels on high energy versus low energy days to confirm the link.
Four Items to Log Daily for Caffeine, Alcohol, and Hydration Tracking
- Caffeine intake in milligrams and timing. Note when you consume it and whether energy dips coincide with typical caffeine half life windows (3 to 5 hours later).
- Alcohol servings and type. Log amount and timing, then check next morning energy and sleep quality ratings.
- Total hydration in milliliters. Track water, herbal tea, and other non caffeinated fluids to spot dehydration patterns on low energy days.
- Urine color or frequency. A quick visual hydration check; dark urine often correlates with fatigue and poor focus.
Weekly Analysis: Spotting Consistent Patterns Between Food and Energy
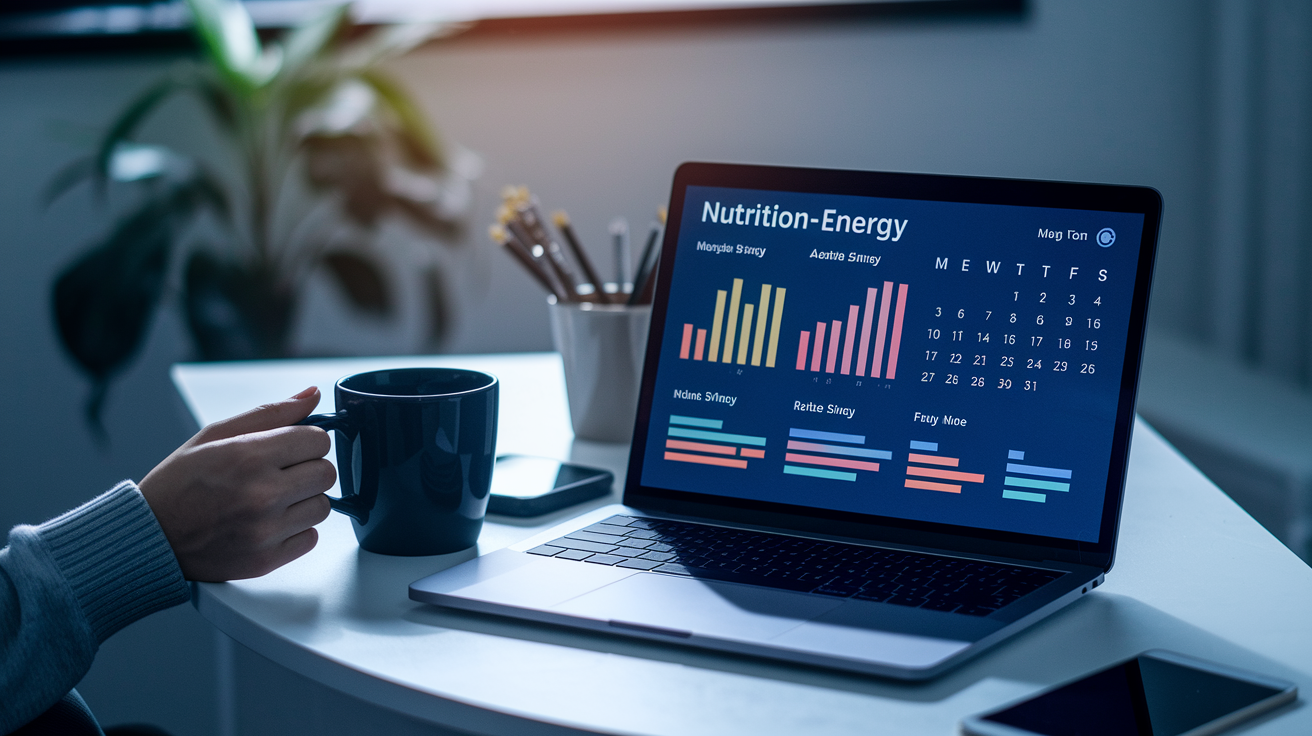
Patterns don’t reveal themselves in single meals or isolated days. Collect a full week of food and energy logs, then sit down and compare averages, highs, lows, and recurring themes. Calculate your average pre meal, 1 hour, and 3 hour energy scores for breakfasts, lunches, and dinners separately. Meals that consistently score above your personal baseline are keepers; those that repeatedly score below it need adjustment.
Look beyond averages to identify your top energy triggers (the foods or meals that reliably lead to crashes, cravings, or fatigue) and your top boosters that keep you steady and alert. Food quality usually explains more than calorie counts: a 500 calorie meal of grilled chicken, quinoa, and vegetables will produce a different energy curve than 500 calories of pizza or a large muffin. Track which meals include whole grains, lean protein, and healthy fats versus refined carbs and added sugars, then correlate those patterns with your logged energy scores across the week.
| Pattern Type | What to Compare | What It Suggests |
|---|---|---|
| Post meal energy crash (3 hour score drops 3+ points) | Carb type, added sugar, protein/fat content | Likely refined carbs or high sugar causing blood sugar spike then drop |
| Sustained energy (3 hour score stays within 1 point of 1 hour) | Whole grains, fiber, protein, fat balance | Balanced macros and quality carbs keeping blood sugar stable |
| Increased cravings 2 to 3 hours after eating | Protein grams, fiber grams, meal size | Insufficient protein/fiber or too small portions leading to hunger rebound |
| Low morning energy despite good sleep | Dinner timing, late night snacks, alcohol, hydration | Late eating, alcohol, or dehydration disrupting overnight recovery |
Using Personalized Nutrition Experiments to Improve Energy Stability
Once you’ve tracked baseline patterns for a week or two, start running small experiments to test what actually works for your body. Change one variable at a time (swap refined grains for whole grains at breakfast, add 20 grams of protein to lunch, cut added sugar for a week) and keep logging energy ratings 1 to 3 hours after meals. This approach, sometimes called an n of 1 trial, isolates the effect of single changes so you know exactly what moved the needle.
Low carb versus higher carb meals often show different glycemic stability and energy outcomes depending on your metabolism, activity level, and insulin sensitivity. Some people feel sharper and steadier on moderate carbs from whole grains and starchy vegetables, while others do better with lower carbs and higher fat. Test both for one to two weeks each while tracking pre meal and post meal energy, then compare average scores and subjective notes. The same goes for meal frequency. Some people thrive on three larger meals, others need smaller meals with snacks to avoid dips.
Iterate every 2 to 12 weeks by reviewing logs, picking the next variable to test, and refining your meal structure and food choices. Personalized experiments beat generic advice because your digestion, activity, stress, and metabolic health are unique. What stabilizes energy for one person might cause crashes for another, so your logs become the evidence base for your own nutrition plan.
Five Practical Nutrition Experiments to Test for Energy Gains
Swap refined grains for whole grains at one meal daily. Compare energy and cravings across two weeks to confirm whether fiber and slow release carbs improve steadiness.
Increase protein by 10 to 20 grams at breakfast. Test whether more protein reduces midmorning crashes and hunger.
Cut added sugars below 25 grams per day. Track energy swings and cravings to see if eliminating spikes smooths your daily rhythm.
Move most carbs to breakfast and lunch, lighter carbs at dinner. Check whether evening energy and next morning alertness improve.
Add a prebiotic or probiotic food daily for two weeks. Log digestion quality and energy to test whether gut health improvements affect absorption and steadiness.
Final Words
Start by logging a simple baseline for three to seven days: what you eat, portions, basic macros, hydration, sleep, stress, and quick energy ratings before and after meals.
Use those logs to spot fast clues. Refined carbs often bring quick spikes and crashes. Meals with protein, fiber, and healthy fats tend to keep energy steadier. Track caffeine and alcohol too, and note gut or sleep symptoms.
Try one small experiment this week and watch results. This practical loop is log, spot patterns, change one thing, reassess. It shows how to track nutrition impact on energy. You’ll get clearer days ahead.
FAQ
Q: How do I set up a simple tracking system to see how foods change my daily energy?
A: A simple tracking system records baseline metrics, meals, and 1–10 energy ratings before meals, 30–60 minutes after, 2–3 hours after, and at bedtime, plus calories, macros, hydration, sleep, and stress for a week-long test.
Q: Which nutrition metrics should I track to understand energy?
A: The key metrics to track are protein, carbohydrates, fat, fiber, added sugar, whole-grain servings, vegetables, healthy fats, hydration in mL, and whether carbs are whole or refined.
Q: How and when should I rate my energy during the day?
A: You should rate energy on a 1–10 scale before eating, about 30–60 minutes after, 2–3 hours after, and at bedtime, noting sleep, caffeine, stress, and activity to add context for patterns.
Q: What meal timing and composition changes help prevent energy crashes?
A: Regular meals, avoiding long skips, and pairing protein, fiber, and healthy fats with carbs help prevent crashes; track meal timing, portion size, and refined versus whole carbs to spot triggers.
Q: How can tracking blood sugar improve my energy insights?
A: Tracking blood sugar shows spikes and crashes tied to foods; measure at 30–60 minutes and 2–3 hours post-meal with a CGM or fingerstick to compare whole grains versus refined carbs effects.
Q: What gut symptoms should I log to link gut health with energy?
A: Log symptoms like bloating, gas, irregular stools, and fatigue after eating, plus which fermented or high-fiber foods you ate, to spot food sensitivities or digestion-related energy drains.
Q: How should I log caffeine, alcohol, and water to avoid misreading energy patterns?
A: Log caffeine milligrams and timing, alcohol amount and timing, and hydration in mL; note late caffeine or evening alcohol since they can mask or cause next-day low energy.
Q: How do I analyze weekly logs to spot food-energy patterns?
A: Analyze 7–14 day averages for pre/post-meal energy, identify repeated dips after certain foods, compare top triggers and boosters, and focus on food quality patterns over single-day noise.
Q: How do I run simple experiments to find which foods boost my energy?
A: Run one-variable n-of-1 tests for 1–2 weeks, track energy 1–3 hours after meals, compare results, then iterate; try low versus higher carb meals or swapping refined carbs for whole grains.