


Think you need a fancy watch to fix your sleep? Think again.
A small notebook, a clock, and five minutes each morning can show when you sleep, how long, and what messes it up.
Over 14 to 30 nights a simple log reveals clear cause and effect you can act on.
This post walks you through an easy log setup, what to record, and the quick calculations that turn notes into useful patterns.
No apps, no subscriptions, just a repeatable habit that helps you test real changes.
Core Manual Methods for Tracking Sleep Patterns Effectively

Manual sleep tracking works by recording bedtime, wake time, and sleep quality observations using nothing more than a pen, paper, and clock. The goal is to build a consistent dataset over 14 to 30 nights that reveals when you sleep, how long you sleep, and which lifestyle factors disrupt or improve rest. Unlike automated wearables, manual methods require deliberate recording every morning and evening. That daily discipline delivers clear cause and effect visibility without batteries, apps, or subscription fees.
Start by gathering a notebook or printable template, a pen that won’t run out, and a reliable bedside clock or watch. Each night, place the notebook and pen within arm’s reach. In the morning, ideally within five minutes of waking, write down the previous night’s data. Evening entries capture influencing factors such as caffeine, exercise, or stress levels. This two touch system keeps the cognitive load low and makes each entry quick enough to sustain for a full month.
Sleep latency, total sleep time, and perceived quality all require estimation rather than sensor measurement. You’ll record the clock time when you tried to fall asleep, then estimate how many minutes passed before you actually fell asleep. Count the number of times you woke during the night and estimate how long each awakening lasted. These estimates become more accurate after a few nights of practice and give you enough precision to spot meaningful patterns.
- Prepare your materials the night before. Notebook open to a blank line, pen tested, clock visible.
- Record your bedtime and lights out time as soon as you get into bed and turn off screens.
- Estimate sleep latency the next morning by recalling roughly how long it took to fall asleep. Round to the nearest five minutes.
- Count and note awakenings as you remember them, including estimated minutes awake for each episode.
- Write down your final wake time and the moment you got out of bed using the same clock source every morning.
- Rate your sleep quality on a simple 1 to 5 or 1 to 10 scale and add brief notes about anything unusual, such as noise, temperature, or vivid dreams.
Building a Manual Sleep Log Structure That Works
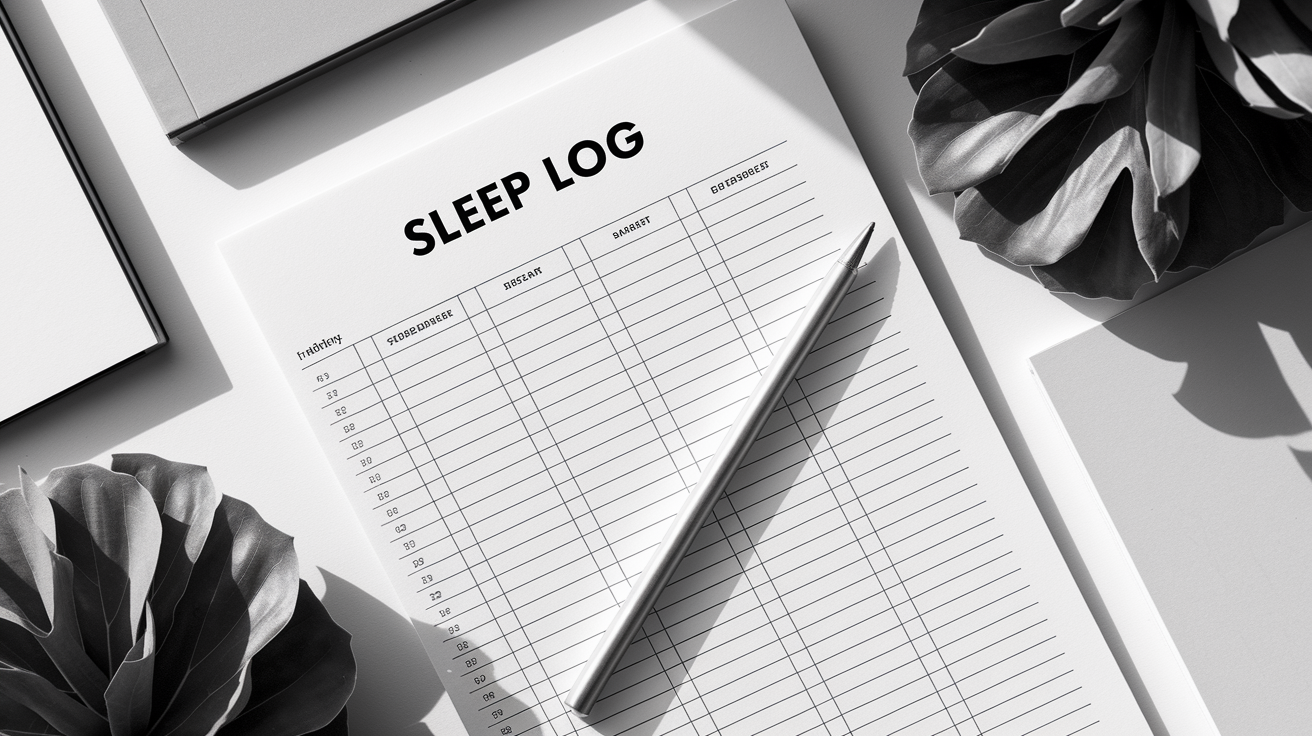
A consistent column layout prevents decision fatigue and keeps each morning entry under sixty seconds. Start with Date in the leftmost column, then move right through Bedtime, Lights Out, Sleep Latency, Number of Awakenings, Total Minutes Awake After Sleep Onset (WASO), Final Wake Time, Out of Bed Time, Time in Bed, Total Sleep Time, Sleep Quality, Naps, Caffeine/Timing, and a Notes column on the far right. This single line per night format fits comfortably on a standard notebook page or printed template and lets you scan a week’s worth of data at a glance.
Fixed order matters because you stop thinking about where to write and simply fill in the next open cell. If you use a notebook, dedicate one page to column headers and draw light vertical lines with a ruler to create columns. If you prefer printed templates, set up a simple spreadsheet on your computer, print thirty copies, and keep them on a clipboard beside your bed. Either approach works as long as you use the same structure every morning.
- Date: Write the date of the night you’re logging. For example, if you woke on March 3, log the night of March 2–3 under March 2.
- Bedtime: The clock time you got into bed, even if you read or scrolled for a while.
- Lights Out: The moment you turned off the light and tried to sleep.
- Sleep Latency (min): Your best estimate of minutes between lights out and falling asleep.
- Number of Awakenings: A simple count. If you woke twice, write 2.
- WASO (min): Total minutes you spent awake after first falling asleep, summing all awakening durations.
- Final Wake Time: The clock time you first opened your eyes in the morning.
- Out of Bed Time: The clock time you physically got out of bed and ended the sleep opportunity.
Calculating Key Sleep Metrics Manually

Manual calculation transforms raw times into actionable sleep metrics. Time in Bed (TIB) measures your sleep opportunity window, Total Sleep Time (TST) estimates actual sleep, and Sleep Efficiency compares the two to show how much of your bed time you spend asleep. These calculations require basic subtraction and division but deliver the same core insights sleep clinics use to evaluate patients.
Work through the math each morning or batch calculate once a week. First, subtract Lights Out from Out of Bed to find TIB. For example, lights out at 23:00 and out of bed at 07:00 gives 8.0 hours TIB. Next, subtract Sleep Latency and WASO from TIB to find TST. If you took 20 minutes to fall asleep and spent 30 minutes awake during the night, subtract 0.33 hours (20 minutes) and 0.50 hours (30 minutes) from 8.0 hours to get 7.17 hours TST. Finally, divide TST by TIB and multiply by 100 to calculate Sleep Efficiency. In this example, (7.17 ÷ 8.0) × 100 equals 89.6 percent.
Healthy sleep efficiency typically runs 85 percent or higher. Values between 75 and 84 percent suggest mild fragmentation or difficulty falling asleep, while anything below 75 percent points to significant insomnia symptoms or other sleep disorders. Sleep latency under 30 minutes is considered normal. Longer latencies indicate trouble initiating sleep. WASO under 30 minutes per night is ideal. Higher totals mean you’re spending substantial time awake in the middle of the night.
| Metric | Formula | Example |
|---|---|---|
| Time in Bed (TIB) | Out of Bed Time − Lights Out Time | 07:00 − 23:00 = 8.0 hours |
| Total Sleep Time (TST) | TIB − Sleep Latency − WASO | 8.0 h − 0.33 h − 0.50 h = 7.17 hours |
| Wake After Sleep Onset (WASO) | Sum of all awakening durations | 15 min + 10 min + 5 min = 30 minutes |
| Sleep Efficiency (%) | (TST ÷ TIB) × 100 | (7.17 ÷ 8.0) × 100 = 89.6% |
Identifying Sleep Patterns and Trends by Hand

Weekly and monthly aggregation uncovers trends that nightly numbers hide. Every seven days, compute the average TST by adding up the seven nightly totals and dividing by seven. Do the same for Sleep Efficiency and Sleep Latency. After 14 or 28 days, calculate longer averages and compare weekday nights to weekend nights. If your weekday average is 6.5 hours but your weekend average is 8.2 hours, that 1.7 hour gap signals chronic weekday sleep debt and suggests you need an earlier weekday bedtime or a later wake time.
Variability matters as much as the average. If nightly TST swings by more than 1.5 hours, say 5.5 hours one night and 7.5 hours the next, your schedule is inconsistent enough to disrupt circadian rhythm. Calculate standard deviation by hand if you’re comfortable with the formula, or simply note the range between your shortest and longest nights. A range wider than two hours across a month indicates irregular sleep timing that may contribute to daytime fatigue and poor sleep quality.
- Late evening caffeine correlation: Compare nights when you consumed caffeine after 3 p.m. to those when you didn’t, and check whether sleep latency or WASO increased by 10 or more minutes.
- Weekend schedule drift: Look for bedtime and wake time shifts of 90 minutes or more from Friday night through Sunday morning compared to weeknights.
- Nap interference: Identify afternoons when you napped for more than 60 minutes and check whether that night’s TST or Sleep Efficiency dropped noticeably.
- Environmental triggers: Scan your notes column for repeated mentions of noise, temperature above 24°C, or room light, and see if those nights cluster with more awakenings.
- Exercise timing benefit: Compare nights when you exercised in the morning or afternoon to nights with evening workouts or no exercise, noting differences in sleep latency and subjective quality ratings.
Tracking Lifestyle Factors That Influence Sleep Patterns
Daytime habits shape nighttime sleep in ways that only become obvious when logged side by side. Record caffeine intake by writing the number of servings (one cup of coffee, one energy drink) and the time you consumed each. Do the same for alcohol, noting standard drink units and the clock time. Evening alcohol within three hours of lights out often shortens total sleep time and increases middle of the night awakenings, even though it may speed initial sleep onset. Late caffeine, anything after 2 or 3 p.m. for most people, commonly adds 10 to 20 minutes to sleep latency and reduces sleep efficiency by several percentage points.
Physical activity and stress levels belong in the log too. Write a brief exercise note each day: “30 min run, 7 a.m.” or “weights, 6 p.m.” to track timing and intensity. Rate daily stress on a 1 to 10 scale and jot a word or two if something unusual happened. Tight work deadline, argument, travel. Over two weeks these entries reveal whether high stress days reliably lead to worse sleep or whether morning workouts consistently improve your sleep quality rating. You might also note total screen time or specific evening screen use, especially in the hour before bed.
Environmental details add a third layer of context. Write down bedroom temperature if it felt unusually hot or cold, note construction noise or a neighbor’s party, mention whether you used blackout curtains or left a window open. Light exposure can be tracked as “bright sun 20 min, 8 a.m.” or “dim evening only.” Even brief notes like “room stuffy” or “pillow uncomfortable” help you spot links between environment and restless nights. When you review a month of logs, a pattern might emerge: every night with room temperature above 24°C corresponded to an extra awakening and lower sleep quality ratings.
Creating Simple Manual Visualizations of Sleep Patterns

Hand drawn charts turn columns of numbers into instantly readable trends. A line graph of nightly TST makes it obvious whether your sleep duration is stable, climbing, or declining across 30 days. Draw a horizontal x axis labeled Day 1 through Day 30 and a vertical y axis labeled 0 through 10 hours. Plot a dot for each night’s TST and connect the dots with a continuous line. Upward slopes show improvement. Downward drifts signal accumulating sleep debt. Flat stretches confirm consistency. This single visual often reveals patterns you’d miss by staring at a column of numbers.
Bar charts work well for categorical data such as nightly sleep quality ratings. Draw 30 vertical bars, one per night, with height corresponding to your 1 to 5 or 1 to 10 rating. Color code the bars if you have colored pens. Green for ratings of 4 or 5, yellow for 3, red for 1 or 2. You’ll see clusters of good and bad nights at a glance. Scatter plots can compare two variables: plot caffeine consumption time on the x axis and sleep latency on the y axis to test whether later caffeine reliably pushes latency higher.
- 30 day TST line chart: x axis days 1 to 30, y axis hours 0 to 10. Plot nightly totals and connect with a line to show trends and weekly cycles.
- Sleep quality bar chart: one bar per night, height matching 1 to 5 rating. Use different colors to make patterns pop.
- Caffeine timing scatter plot: x axis time of last caffeine (e.g., 2 p.m., 5 p.m.), y axis sleep latency in minutes. Each dot is one night.
- Weekday vs weekend comparison table: draw a simple two column table showing average weekday TST and average weekend TST side by side.
- Awakening frequency histogram: count how many nights had 0, 1, 2, 3, or more awakenings and draw bars for each category.
- Manual hypnogram sketch: for a single night, draw a timeline from lights out to wake up and mark each awakening with a vertical spike. This approximates the shape of a clinical hypnogram based on your recorded awakenings rather than actual sleep stages.
Sample Manual Sleep Log Templates You Can Recreate
Copy the column structure below into any notebook or print it as a table to use each night. The daily template fits one line per date and captures every essential metric in a single row. Start a new page each week or print seven rows per page and staple them together. If you prefer a monthly overview, create a separate summary page with Date, TST, TIB, Sleep Efficiency, Quality, and Notes columns, leaving space at the bottom for 7 day, 14 day, and 30 day average lines plus a standard deviation row.
| Column Name | Purpose | Example Entry | Notes |
|---|---|---|---|
| Date | Identifies the night being logged | 03/02/2025 | Use night date, not wake date |
| Bedtime | Clock time you got into bed | 22:45 | Include time spent reading or on phone |
| Lights Out | When you tried to fall asleep | 23:10 | Marks start of sleep opportunity |
| Sleep Latency (min) | Estimated minutes to fall asleep | 25 | Round to nearest 5 minutes |
| # Awakenings | Count of times you woke | 2 | Integer count; bathroom trips count |
| WASO (min) | Total minutes awake after first sleep | 20 | Sum all awakening durations |
| Final Wake | First time you opened eyes in morning | 06:50 | Even if you dozed again afterward |
| Out of Bed | When you physically got up | 07:05 | Marks end of sleep opportunity |
Troubleshooting Common Issues in Manual Sleep Tracking

The most frequent mistake is inconsistent recording. Logging five nights, skipping the weekend, then resuming Monday. Missing weekend data hides schedule shifts and makes weekday versus weekend comparisons impossible. Set a daily alarm or sticky note reminder on your bathroom mirror to trigger the morning entry. Recording within five minutes of waking captures the freshest memory of awakenings and sleep quality. If you wait until lunch or evening to fill in the log, estimates grow vaguer and patterns blur.
Vague time entries undermine calculation accuracy. Writing “sometime after 11 p.m.” for bedtime or “around 7ish” for wake time introduces error ranges of 30 minutes or more, enough to distort TST and efficiency. Use the same clock or watch every night, ideally one that’s always visible from bed, and write exact times to the minute. If you wake during the night and check the clock, jot the time on a bedside notepad immediately so you don’t forget the awakening duration by morning.
- Skipping nights or weekends. Set a recurring phone alarm labeled “Log last night’s sleep” for the same time each morning. Treat it as non negotiable as brushing your teeth.
- Estimating times hours later. Keep a pen and small notepad on your nightstand. If you wake at 3:47 a.m., scribble “3:47” so you remember the awakening in the morning.
- Using different clocks. Stick to one clock source (phone, bedside clock, or watch) to avoid discrepancies between devices that may be off by several minutes.
- Forgetting lifestyle factors. At dinner or bedtime, fill in caffeine, alcohol, exercise, and stress entries for that day so the context is logged before you sleep.
- Giving up after a week. Commit to 14 nights minimum. Patterns often don’t emerge until the second week, and monthly data is even more revealing.
When Manually Tracked Sleep Data Indicates It’s Time for Professional Help

Persistent red flags in your log warrant a conversation with a healthcare provider or sleep specialist. If your calculated sleep efficiency stays below 75 percent for two or more consecutive weeks, or if your total sleep time averages under six hours nightly despite spending eight hours in bed, you may be dealing with insomnia or another clinical sleep disorder. Chronic WASO above 30 minutes every night, especially if you’re wide awake for 20 or 30 minutes during each awakening, suggests fragmented sleep that won’t improve with simple habit changes alone.
Notes columns that repeatedly mention loud snoring, gasping, or breathing pauses are strong signals of possible obstructive sleep apnea, even if your TST looks normal. Restless legs, uncomfortable sensations that force you to move your legs at bedtime, or involuntary leg jerks that wake you or your bed partner also deserve clinical evaluation. Bring your completed manual log to the appointment. Physicians and sleep clinicians use diary data to decide whether to order an overnight polysomnography study, refer you for Cognitive Behavioral Therapy for Insomnia (CBT-I), or explore medical treatments such as CPAP. Your handwritten numbers provide the baseline that makes those decisions faster and more accurate.
Final Words
Start logging with the basics: date, bedtime, lights-out, wake times, sleep latency, awakenings, and a quick quality score. Use one-line-per-night and the same clock to keep it tidy.
Then calculate TIB, TST, WASO, and efficiency, draw a simple 30-day line, and note habits like caffeine and naps. Troubleshoot inconsistencies and know red flags that mean seeing a clinician.
This gives a practical, testable way to learn how to track sleep patterns manually. Keep testing small changes and celebrate clearer nights ahead.
FAQ
Q: What is the 10 5 3 2 1 rule for sleep?
A: The 10-5-3-2-1 rule for sleep is a stepwise pre-bed timeline setting cutoffs for key behaviors—like caffeine, big meals, alcohol, screen use, and a calm wind-down—to help your body prepare for sleep.
Q: How can I track my sleep patterns?
A: You can track your sleep patterns by keeping a nightly sleep log: note date, bedtime, lights-out, sleep latency, awakenings, final wake, out-of-bed time, perceived quality, and track for 14–30 days to spot patterns.
Q: Does sleep cycle track snoring?
A: Sleep Cycle can track snoring using your phone’s microphone if you enable sound detection, but it’s not a medical-grade snore monitor and may miss or mislabel sounds.
Q: Is 40 minutes of deep sleep a night enough?
A: Forty minutes of deep sleep a night may be low for many adults but could be enough if total sleep and efficiency are good; watch daytime tiredness and track over two weeks to decide.