


What if tracking recovery with one big number is making you miss the real progress?
Small daily metrics like sleep, midday pain, steps, and mood build up a clear pattern you can test and change.
Read on for a short, practical system to pick 4 to 6 simple daily signals, set a baseline, and run tiny experiments that show if you’re improving.
You’ll end up with real clues, not guesswork, and a few small steps to try this week.
Core Methods for Tracking Recovery Progress Effectively
Recovery isn’t a single number. It’s not just “pain down to 2 out of 10” or “stayed sober for 30 days.” Real progress shows up in how you move through your day, how you sleep, whether you can climb stairs without wincing, and how often you actually feel okay. To measure recovery well, you need to watch multiple signals over time and treat each area as its own little experiment. You’re collecting evidence, not waiting for a perfect report card.
Most people track either too much or too little. They write down every tiny shift in mood and feel overwhelmed by data, or they rely entirely on memory and miss patterns that could change everything. The balance is tracking enough core signals to spot trends but keeping things simple enough that you actually do it. This means choosing a handful of objective measures (things you can count, test, or rate consistently) and pairing them with subjective measures (what you notice, how you feel, changes that matter to you). Both types matter. A blood pressure reading tells one story. How hard it is to get out of bed tells another.
Frequency matters too. Some signals need daily check ins. Others show up best when you look weekly or monthly. Daily logs catch the small shifts, like cravings that spike at 4 p.m. or pain that gets worse after you skip stretching. Weekly summaries help you see whether those daily blips are random or part of a real pattern. Monthly or quarterly reviews show bigger picture trends, like whether your stamina is actually improving or whether setbacks are clustering around the same triggers.
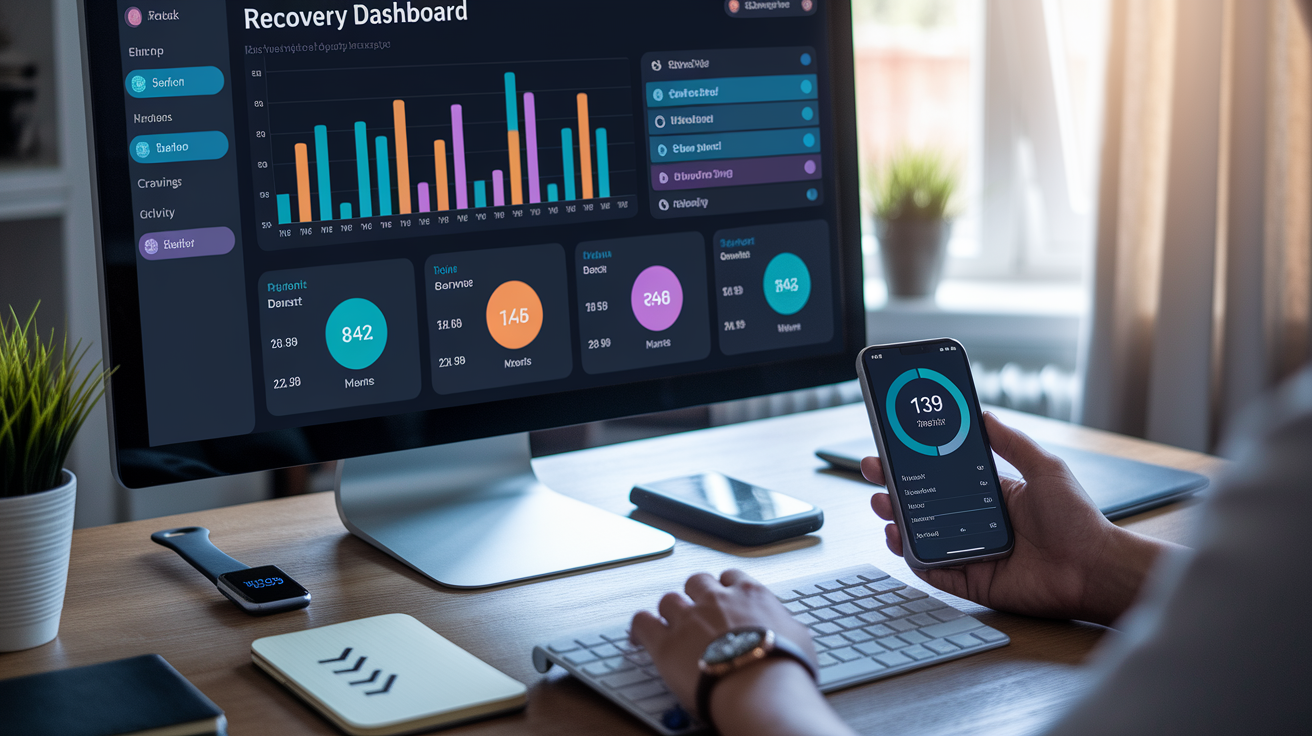
Here’s what a solid recovery tracking system usually includes:
A daily symptom or mood journal where you note intensity, timing, and context for pain, cravings, energy, or emotions. A tracking app or wearable device that automatically logs sleep hours, activity levels, heart rate, or steps without you needing to remember. Progress photos or videos that capture physical changes, movement quality, posture shifts, or functional abilities you can compare side by side. Symptom severity logs using simple 0 to 10 scales for pain, fatigue, stress, or concentration so you can spot upward or downward trends quickly. Standardized assessments or checklists administered by a provider or therapist at set intervals (intake, 3 months, 6 months, 12 months) to measure quality of life, functioning, or mental health status objectively. Milestone timelines that list concrete recovery goals (walk without a cane, return to work, attend three social events this month, complete physical therapy) and mark the dates you hit them.
Setting Baselines and Measurable Recovery Goals
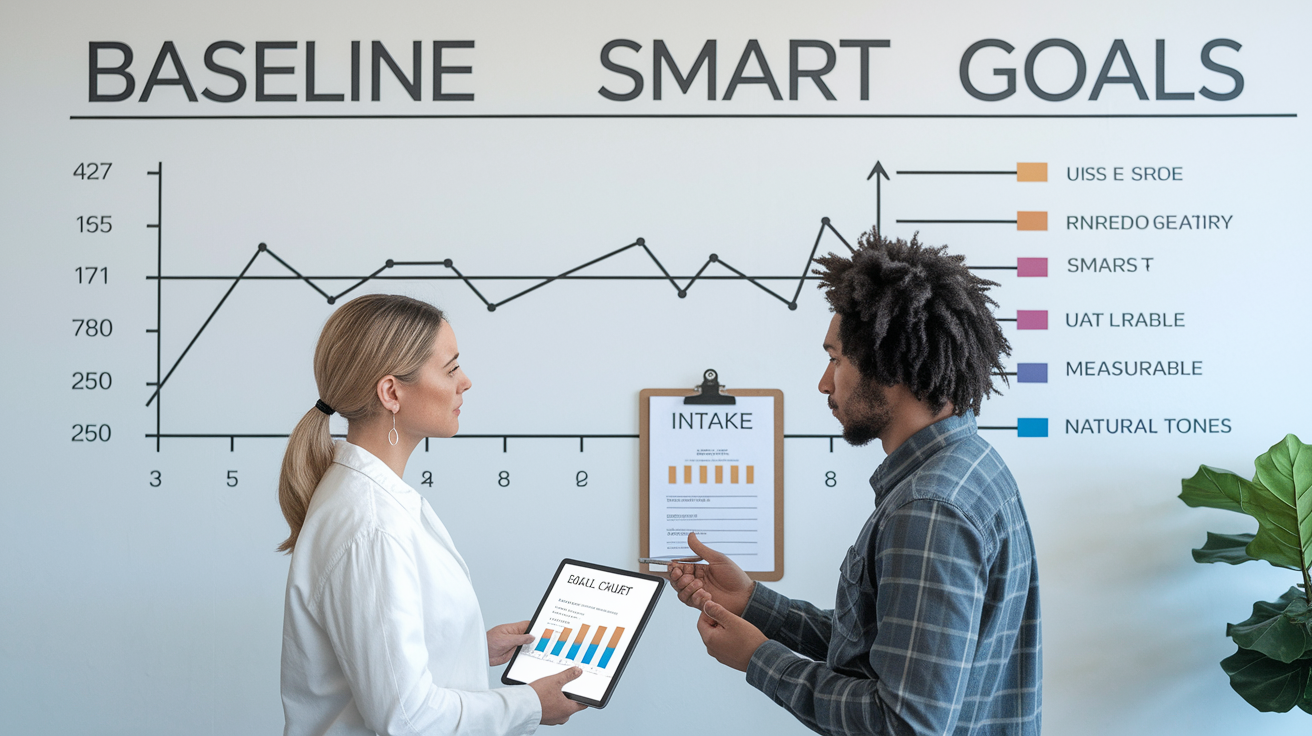
You can’t track progress unless you know where you started. Before you measure improvement, you need a baseline snapshot of your current reality: how much pain you’re in right now, how many steps you walk today, how often you use coping skills this week, whether you can lift your arm past shoulder height. Intake assessments capture this starting point across physical health, mental health, daily functioning, and relationships. Tools like the Addiction Severity Index or WHO Quality of Life Instrument quantify employment status, psychiatric symptoms, social support, and overall wellbeing so you have numbers and categories to revisit later. Without a clear baseline, “I feel better” stays vague and unmeasurable.
Once you have your baseline, turn those numbers into goals using SMART logic: specific, measurable, achievable, relevant, and time bound. Instead of “get stronger,” aim for “increase seated leg press from 50 pounds to 80 pounds within 8 weeks.” Instead of “improve mood,” track “reduce average daily mood rating from 3 out of 10 to 6 out of 10 over the next month by practicing one grounding exercise daily.” The baseline tells you the gap. The goal tells you the target and the timeline. Then you adjust as real data comes in.
| Baseline Metric | What to Measure | Example Follow-Up Change |
|---|---|---|
| Pain intensity (0–10 scale) | Average daily pain score over one week | Baseline 7/10 → 3 month 4/10 (43% reduction) |
| Range of motion (degrees) | Shoulder abduction measured by PT at intake | Baseline 90° → 6 week 140° (55° gain) |
| Days substance free | Count consecutive days without use | Baseline 0 days → 30 day 22 days sober |
| 6 minute walk distance (meters) | Total distance walked in 6 minutes | Baseline 200m → 8 week 350m (75% improvement) |
Daily and Weekly Recovery Monitoring Systems

Daily logs catch the signals that disappear from memory by the end of the week. You might forget that Tuesday’s pain spiked after skipping your stretches, or that Thursday’s craving hit hardest right after a stressful call. Writing it down while it’s fresh turns those moments into data you can review later. A simple daily log might include pain intensity on a 0 to 10 scale, mood rating, hours of sleep, any missed therapy sessions or exercise, and a quick note about what was different that day. Keep it short. Five fields, two minutes, done.
Sleep is one of the most powerful recovery signals you can track daily. Aim for 7 to 9 hours. Sleep below 6 hours is linked to decreased strength, higher injury risk, and slower healing. Log when you go to bed, when you wake up, and how rested you feel on a simple 1 to 5 scale. If your sleep log shows three nights in a row under 6 hours and your pain or mood scores are climbing, you’ve spotted a pattern worth addressing. Maybe bedtime needs to shift earlier. Maybe screen time is pushing sleep back. The log shows the clue.
Weekly summaries roll up the daily signals so you can see the bigger shape. At the end of each week, tally total days with low pain, average mood score, total therapy or exercise sessions completed, and any notable triggers or wins. This summary takes less than ten minutes and turns a pile of daily notes into a trend you can actually use. If pain stayed low on days you did your exercises and spiked on days you skipped them, that’s a clear pattern. If mood improved after you made three support calls but tanked when you isolated, you know what to test next.
Here’s what a practical daily tracking routine looks like:
Rate your main symptom (pain, craving, fatigue, anxiety) on a 0 to 10 scale and note the time of day it was worst. Log total sleep hours and mark whether you woke up feeling rested or groggy. Record your mood on a simple 1 to 10 scale and add one sentence about what influenced it (good conversation, argument, skipped meal, tough workout). Track your activity level: steps walked, minutes of exercise, physical therapy completed, or just a yes or no for “moved today.” Note any pain location changes, new symptoms, or improvements in function (climbed stairs easier, lifted grocery bag without help, focused through a full meeting).
Physical Recovery Tracking: Mobility, Strength, Pain, and Function

Physical recovery shows up in what your body can do today that it couldn’t do last week. The clearest signals are mobility gains, strength improvements, pain reductions, and functional wins like walking farther, lifting more, or moving through your morning routine without needing a break. Track these signals at regular intervals so you can compare apples to apples. Weekly mobility checks, monthly strength tests, and quarterly functional assessments give you concrete evidence of progress or stagnation.
Pain trends matter more than single readings. A pain score of 6 out of 10 on Tuesday means less than the pattern across two weeks. If your average daily pain dropped from 7 to 4 and you’re using less medication, that’s real improvement. If pain is still averaging 7 but now it only spikes after specific activities (lifting bags, sitting too long), you’ve identified triggers to work around. Pain logs should capture intensity, location, timing, what makes it worse, and what makes it better. Over time, those notes show whether your pain is shrinking, shifting, or stuck.
Tracking Mobility and Movement Quality
Mobility tracking starts with simple range of motion checks you can do at home or with a provider. Can you lift your arm overhead today? How far can you bend forward without pain? Can you squat to pick something off the floor? Measure these movements in degrees if you have a goniometer or a PT helping, or just describe them in plain language: “lifted arm to ear level,” “touched toes with straight legs,” “walked 10 minutes without limping.” Repeat the same tests weekly and write down what changed.
Gait quality matters too. Notice whether you’re still favoring one leg, whether your stride feels even, whether you can walk at a normal pace without getting winded. A simple test: time how long it takes to walk 20 feet at your usual speed. Do it once a week. If your time drops from 18 seconds to 12 seconds over a month, your gait and confidence are improving. If it stays stuck or gets slower, something’s interfering, maybe pain, weakness, fear of falling, or fatigue you haven’t addressed yet.
Measuring Strength and Functional Capacity
Strength doesn’t need a gym full of equipment. Functional tests show real world capacity. The Sit to Stand test counts how many times you can stand up from a chair in 30 seconds without using your hands. The Timed Up and Go test measures how long it takes to stand from a chair, walk 10 feet, turn around, and sit back down. A 6 minute walk test tracks total distance covered. Do these tests every 2 to 4 weeks and log the numbers. Small improvements (one more chair stand, 10 extra meters walked, 2 seconds faster on the TUG) add up and prove your body is adapting.
Persistent muscle soreness or fatigue that doesn’t improve signals under recovery. Normal soreness after exercise should fade within 48 to 72 hours. If you’re still sore five days later or your strength output keeps dropping week after week, you’re not recovering enough between efforts. That means adjusting rest days, sleep, nutrition, or training intensity. Strength tests help you catch this early. If your max weight on a leg press drops 10 pounds across two weeks and fatigue is climbing, dial the volume back and reassess in another week.
Mental Health and Emotional Recovery Monitoring
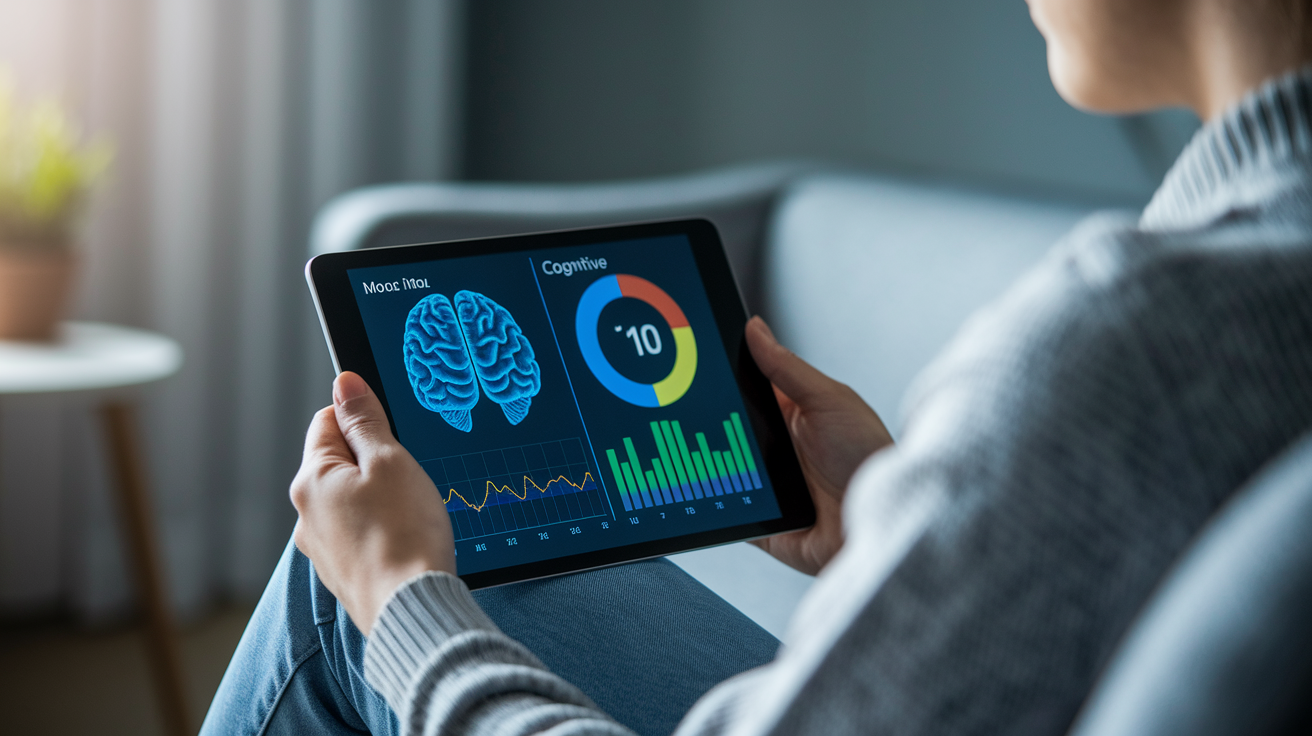
Mental and emotional recovery often lags behind physical recovery, and it’s harder to measure with a single test. You’re tracking shifts in mood stability, anxiety levels, cravings, concentration, motivation, and how often you need crisis support. These signals don’t move in straight lines. A tough week doesn’t erase progress, and a good day doesn’t mean you’re done. The pattern across weeks and months shows whether you’re building emotional resilience or whether stressors are overwhelming your capacity faster than you’re recovering.
Mood logs work best when they’re simple and consistent. Rate your overall mood each day on a 1 to 10 scale, where 1 is “completely overwhelmed” and 10 is “calm and steady.” Add a one sentence note about what influenced it: “slept poorly,” “argued with partner,” “finished a project,” “skipped therapy.” Over time, you’ll spot patterns. Maybe your mood tanks every Sunday night before the work week. Maybe it lifts on days you move your body or talk to a friend. Those patterns help you test small changes and see whether they shift your average score upward.
Cognitive recovery includes focus, memory, and decision making quality. If brain fog or distraction were part of your baseline, track how long you can concentrate on a task without losing the thread. Start with 10 minute blocks and see if that number climbs. Notice whether you’re forgetting appointments less often, whether you can follow conversations without asking people to repeat themselves, whether decisions feel less paralyzing. These improvements are subtle but real. A concentration log might just say “focused through 25 minute work block” or “remembered all three grocery items without a list.” Small wins count.
Common emotional indicators to watch include:
Stress levels: How often do you feel on edge, and does it ease with rest or coping strategies? Motivation: Are you showing up for therapy, exercise, social plans, or are you canceling more often than not? Focus and mental clarity: Can you read a page without re reading it, or sit through a meeting without drifting? Irritability or mood swings: Are small frustrations blowing up into big reactions, or are you managing them more calmly than before?
Social, Lifestyle, and Behavioral Recovery Indicators

Recovery touches every corner of daily life, not just symptoms. Rebuilding trust with family, reconnecting with friends, showing up at work or school, sticking to routines, and making decisions that support your goals are all measurable progress markers. These lifestyle and relationship indicators often move slower than physical metrics, but they’re just as important. If your pain is down but you’re still isolating and avoiding responsibilities, recovery is incomplete.
Social recovery means tracking the size and quality of your support network. Count how many people you can call when you need help or encouragement. Notice how often you’re reaching out versus how often you’re hiding. Are you rebuilding trust by keeping promises, showing up on time, following through on commitments? Relationship strength isn’t just about having people around. It’s about communication quality, shared activities, and whether those connections feel supportive or draining. A simple weekly check might ask: “How many meaningful conversations did I have? Did I reconnect with anyone I’d been avoiding? Did I ask for help when I needed it?”
Lifestyle stability shows up in housing, employment, education, and daily routines. Are you maintaining stable housing? Are you working or attending school regularly? Are you managing money, appointments, and basic self care without constant reminders? Decision making quality improves when you’re less impulsive, when you can weigh options, when you’re choosing long term recovery over short term relief. Track these shifts by noting weekly whether you stuck to your routine, whether you made a tough decision that supported recovery, whether you practiced a coping skill instead of falling back on old patterns.
Behavioral signals to log weekly:
Did you attend scheduled therapy, group sessions, or medical appointments? How many days did you follow your nutrition and hydration plan? Did you practice coping strategies (deep breathing, journaling, grounding exercises) when stress hit? How many high risk situations did you navigate successfully this week? Did you engage in healthy activities like exercise, creative outlets, or time outdoors?
Nutrition and hydration directly influence energy, mood, and physical recovery. Even mild dehydration (around 3 percent of body weight) can reduce muscle strength by roughly 10 percent and tank your focus. Track water intake daily, aiming for pale yellow or straw colored urine as your hydration checkpoint. Log whether you’re eating enough protein to support muscle repair, enough carbohydrates to fuel activity, and enough variety to cover micronutrient needs. If energy crashes every afternoon and your food log shows skipped meals or low calorie days, you’ve found a lever to pull.
Tools, Apps, and Technology for Tracking Recovery
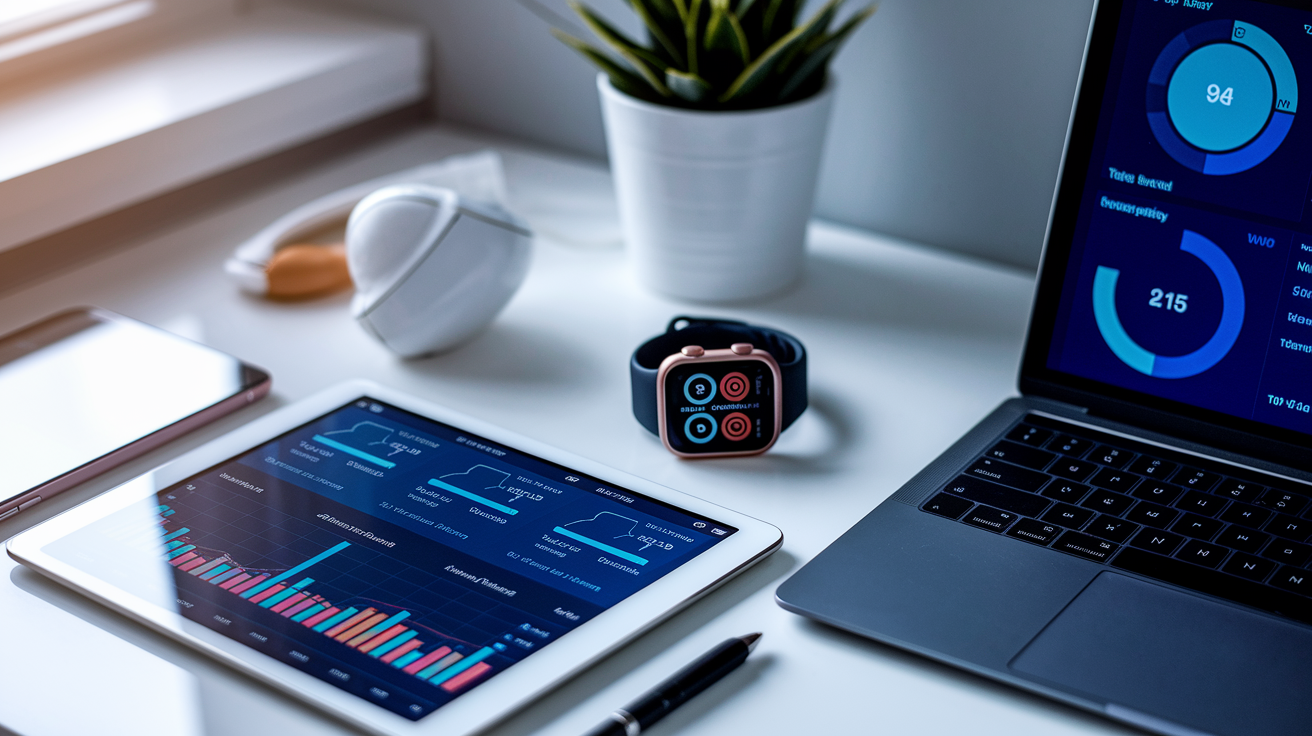
Digital tools turn tracking from a chore into a system that runs in the background. Recovery apps centralize your logs, assessments, mood ratings, and follow up schedules in one place. Wearable devices automatically capture sleep duration, resting heart rate, daily steps, and activity intensity without you needing to remember to write anything down. Remote monitoring platforms let your therapist, coach, or PT see your data between sessions and adjust your plan before small issues become big setbacks. The right tool depends on what you’re recovering from and how much structure you need.
A good recovery app should make tracking faster, not slower. Look for dashboards that show trends at a glance: line charts for pain scores over time, bar graphs for weekly exercise completion, heatmaps for trigger frequency. Alerts and reminders help you log symptoms or take medication on time without relying on memory. Secure data handling matters if you’re sharing logs with providers. Some apps integrate directly with electronic health records so your care team sees updates in real time. Others let you export reports as PDFs for appointments.
Key Features to Look For in a Recovery App
The best apps balance simplicity with depth. You want quick daily logging (tap a number, add a sentence, done) plus the ability to drill into details when you need them. Customizable fields let you track what matters most for your recovery type: pain location and intensity for post surgery, cravings and triggers for addiction, mood and sleep for mental health. Built in questionnaires or validated assessment tools (like PHQ 9 for depression or GAD 7 for anxiety) give you standardized snapshots to compare over time.
Visualization tools turn raw data into insight. A calendar heatmap shows which days were rough and which were good. A trend line shows whether your average pain is climbing, dropping, or flat. Correlation views help you spot connections, like “pain drops on days I sleep 8+ hours” or “cravings spike after skipping breakfast.” Reminder systems keep you on track without being annoying. And if you’re working with a provider, look for secure sharing options so they can review your logs and adjust your plan between visits.
| Tool Type | Best For | Key Features | Example Use Case |
|---|---|---|---|
| Recovery specific apps | Structured symptom and progress tracking | Custom logs, reminders, trend charts, provider sharing | Track post op pain, PT exercises, and mobility milestones daily |
| Wearable devices (fitness trackers, smartwatches) | Automatic activity, sleep, and heart rate monitoring | Step counts, resting HR, sleep stages, activity intensity | Monitor resting heart rate trends to catch early fatigue or stress |
| Mood and mental health apps | Daily mood logs, coping skill tracking, emotional pattern analysis | Mood scales, journaling prompts, CBT exercises, crisis resources | Log daily mood and anxiety to identify triggers and test interventions |
| Centralized care platforms | Coordinating multiple providers and data streams | Integrated assessments, telehealth scheduling, secure messaging | Share physical therapy progress with surgeon and primary care in one system |
Using Data to Adjust Recovery Plans and Recognize Red Flags

Data only helps if you use it to make decisions. The point of tracking recovery isn’t to pile up numbers. It’s to spot patterns, test changes, and know when to adjust your plan or call for help. Trends matter more than single data points. One bad pain day doesn’t mean you’re failing. Three weeks of climbing pain scores while you’re doing everything right means something’s off and needs attention. Look at your logs weekly and ask: Is this getting better, staying the same, or getting worse? If it’s stuck or worsening, what changed, and what can you try next?
Providers use outcome thresholds to guide treatment decisions. If pain isn’t improving after 4 weeks of physical therapy, they might adjust exercises, add manual therapy, or refer you for imaging. If mood scores stay low after 6 weeks of a new medication, dosage or medication type may need to change. If relapse timing shows returns to use happening within days or weeks of high stress events, that’s a signal to build better coping strategies or environmental supports before the next trigger hits. Your tracking data gives your care team the evidence they need to personalize your plan instead of guessing.
Red flags are signals that something needs immediate attention, not just a note in your log. Watch for these and reach out to your provider when they show up:
Pain that’s getting worse instead of better after 2 to 4 weeks of treatment, or new sharp pain that wasn’t there before. Sudden loss of mobility or strength, like not being able to lift your arm when you could yesterday, or losing your balance repeatedly. Mood or anxiety that’s spiraling downward despite using coping strategies, especially if you’re having thoughts of self harm or giving up. Relapse or return to substance use after a period of stability, particularly if it’s happening more frequently or in larger amounts. Sleep that’s persistently under 5 to 6 hours for more than a week, paired with rising fatigue, irritability, or difficulty concentrating. Signs of infection, swelling, fever, or unusual drainage after surgery or injury, or any symptom your provider told you to watch for and report immediately.
Final Words
Track daily signals, set a clear baseline, and test small steps. This guide walked through core methods: what to log each day, physical tests for mobility and strength, mental health checks, social and lifestyle markers, and tools that centralize it all.
Pick one baseline, make a measurable goal, use a simple app or journal, and check trends weekly. Watch for red flags and tweak the plan with your clinician when needed.
Try one habit for a week and see what shifts. That’s a practical start on how to track recovery progress and feel more in control.
FAQ
Q: What is the 3 3 3 rule at the gym?
A: The 3 3 3 rule at the gym is a simple strength template: three exercises, three sets each, done three times per week to build consistency, volume, and recovery without overdoing intensity.
Q: How can I track my recovery?
A: You can track your recovery by combining objective and subjective measures: daily symptom logs, sleep and activity data, progress photos, standardized assessments, and weekly check-ins to spot trends and adjust plans.
Q: What is the 5-3-1 rule?
A: The 5-3-1 rule is a strength training cycle that uses sets of five, three, and one reps at rising intensities each week to progressively overload and increase maximal strength over time.
Q: What are the 3 R’s of recovery?
A: The 3 R’s of recovery are rest, refuel, and rebuild: prioritize sleep and reduced load, eat and hydrate for repair, then add gradual rehab or strength work and social support to regain function.