


Feeling better doesn’t always mean you’re actually recovering.
Small wins can hide big risks, so you need clear signals, not hope.
Recovery progress indicators are those signals, measurable things that show real upward trends across body, mood, behavior, and relationships.
In this post we’ll show core indicators to watch, simple ways to measure them, and quick steps to test whether each change is real.
Use them to spot patterns early and decide what to try next.
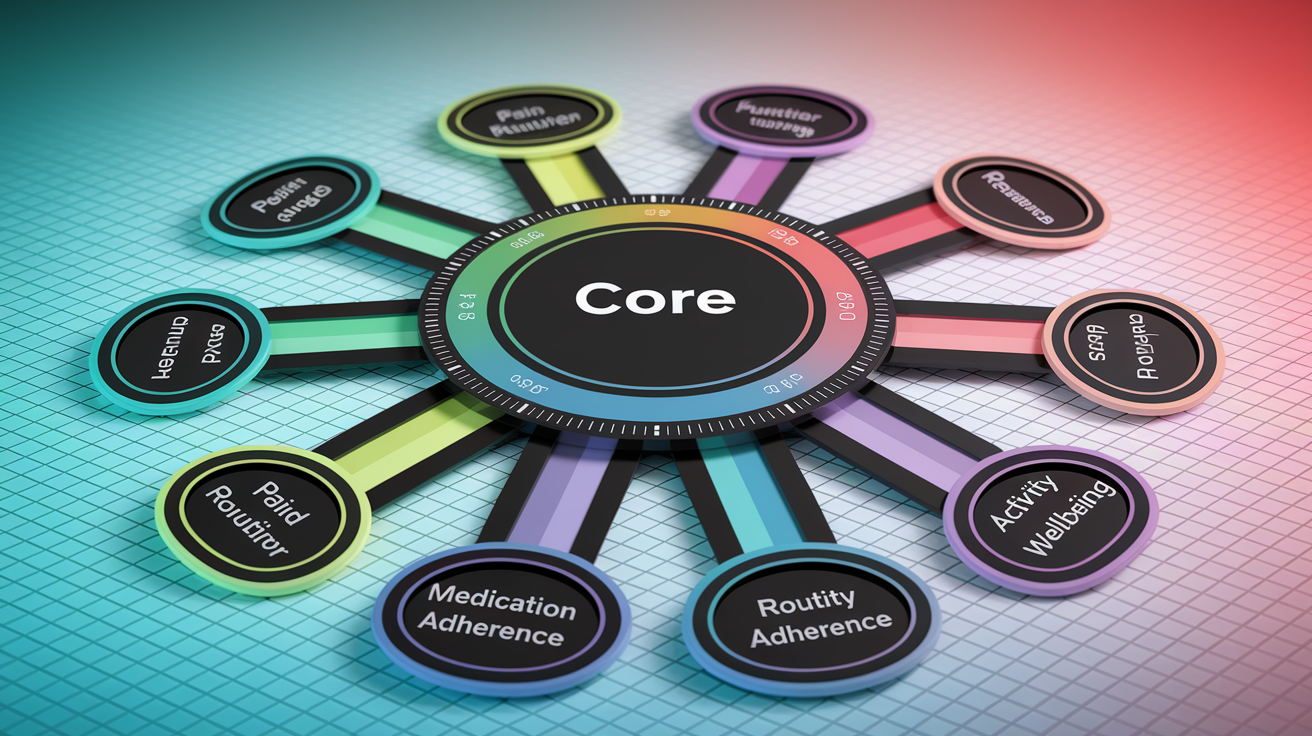
Core Recovery Progress Indicators for Measuring Improvement
Recovery progress indicators are measurable signals that show whether you’re moving forward, staying put, or sliding back. They turn vague feelings like “doing better” into trackable data you can actually review. Instead of guessing how things are going, you watch patterns across days, weeks, and months to spot real change.
These indicators work best when they cover multiple areas of your life. Physical health matters, but so do emotions, behavior, relationships, and daily structure. You might feel physically stronger yet struggle socially. Or report stable mood while secretly fighting cravings. Tracking across dimensions helps you see the full picture and catch early warnings before they turn into full setbacks.
Using objective markers alongside what you report reduces bias and fills in blind spots. Lab results, appointment logs, and validated questionnaires add weight to what you say you feel. Together, these data points build a reliable view of progress that supports better decisions, not just hopeful hunches.
Ten broad categories organize recovery indicators into practical groups:
- Pain measurement across time and activity level
- Functional independence in self care and mobility
- Emotional stability and mood consistency
- Behavioral consistency and impulse control
- Health routines including sleep, nutrition, and exercise
- Social connectedness and relationship quality
- Daily structure and routine adherence
- Adherence patterns to medications and appointments
- Symptom change in physical and mental domains
- Wellbeing measures including life satisfaction and goal progress
Behavioral and Psychological Recovery Progress Indicators Derived from Evidence-Based Metrics

Psychological indicators reveal how you manage stress, regulate emotion, and handle challenges without old coping habits. In the Delphi study of 28 recovery indicators, “coping with problems without turning to drugs or alcohol” scored a mean of 9.43 out of 10. The highest importance rating across all stakeholders. That single finding underscores something critical: people judge recovery success more by new coping skills than by the absence of symptoms.
Managing cravings earned the lowest mean score, 6.15, suggesting that expecting cravings to disappear completely is unrealistic. Instead, effective management matters more. Using strategies, delaying action, riding out the urge. Tracking how often you apply a learned coping tool in response to a trigger shows behavioral progress that a simple yes or no craving question can’t capture.
Six psychological and behavioral indicators go beyond surface mood checks:
- Craving trends tracked daily or weekly, noting intensity, duration, and resolution method
- Coping strategy application frequency, such as the percentage of high risk moments handled without substance use
- Emotional regulation patterns, including time to calm after upset and frequency of emotional outbursts
- Symptom diary consistency, measuring adherence to daily self report logs as a proxy for engagement
- Relapse risk clusters, grouping warning signs like isolation, skipped meetings, or dishonesty
- Behavior stability measures, counting days between impulsive actions or rule violations
Physical and Functional Recovery Progress Indicators
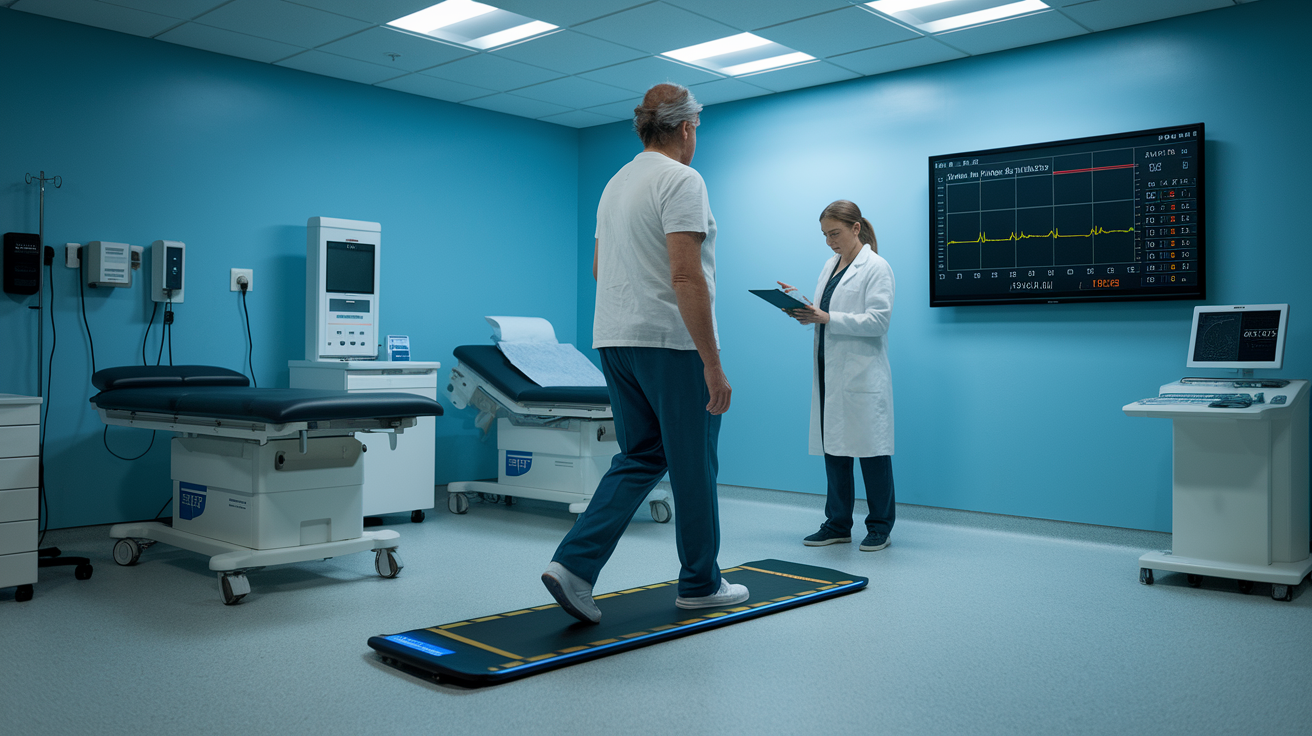
Physical recovery indicators measure your body’s ability to perform, heal, and sustain activity. Range of motion testing tracks joint flexibility in degrees, with improvement typically appearing in 10 to 15 degree increments over weeks. Gait speed, how fast you walk a measured distance, predicts overall physical function and correlates with independence. Slower than 0.8 meters per second flags high fall risk and reduced community mobility.
Strength testing uses standardized protocols such as hand grip dynamometry or five repetition sit to stand tests. Baseline measures at intake set the reference point, and re tests every two to four weeks reveal whether strength is building, plateauing, or declining. Balance evaluations include single leg stance time, tandem walking, or instrumented sway tests. Falls or near falls documented between assessments provide real world context for lab scores.
Nutritional and metabolic markers support physical function. Body mass index stability, dietary intake logs, and fluid balance all contribute to recovery, especially after acute illness or addiction related neglect. Muscle mass tracking via bioimpedance or clinical assessment shows whether nutrition interventions are working. Regular physical assessments catch deterioration early, often before you report feeling worse.
| Indicator | Measurement Method | Frequency |
|---|---|---|
| Range of motion | Goniometry in degrees per joint | Weekly or biweekly |
| Gait speed | Timed 4-meter or 10-meter walk | Monthly |
| Grip strength | Dynamometer reading in kilograms | Every 2–4 weeks |
| Balance evaluation | Single-leg stance seconds or Berg Balance Scale | Monthly or per milestone |
Social, Lifestyle, and Daily-Routine Recovery Indicators

Social and lifestyle indicators capture stability in relationships, housing, income, and how you spend time. The Delphi study rated stable housing, having a regular income, and spending free time on hobbies unrelated to substance use as important recovery markers. These factors form the scaffolding that supports long term change, even when emotional or physical symptoms fluctuate.
Routine adherence metrics track whether you follow a daily schedule, attend appointments, and complete assigned tasks. Consistency in small behaviors matters. Waking at the same time, eating regular meals, logging daily check ins. These predict bigger outcomes. Therapy and support group attendance rates, measured as a percentage over a month, signal engagement level. Rates below 75 percent often correlate with poorer outcomes and warrant a conversation about barriers.
Seven social and lifestyle indicators organize stabilization tracking:
- Routine adherence measured by completion of scheduled activities per week
- Relationship stability assessed through frequency of constructive family or friend contacts
- Housing continuity tracked by days housed without disruption
- Income consistency, whether from employment, benefits, or legal sources
- Hobby and leisure engagement, counting hours per week spent on substance free activities
- Medication and supplement adherence rates as a percentage of prescribed doses taken
- Appointment and follow up completion rates over rolling 30 or 90 day windows
Biological and Clinical Marker Indicators for Tracking Recovery

Biological markers provide objective data on internal recovery that self reports and behavior observations can miss. Blood pressure patterns reveal cardiovascular adaptation, with reductions toward normal ranges appearing weeks to months into recovery. Tracking systolic and diastolic readings weekly during early recovery and monthly later on catches hypertension, which often persists even after other symptoms improve.
Inflammatory markers such as C reactive protein trend downward as the body heals from infection, injury, or chronic substance use. Elevated CRP levels that fail to drop after four to eight weeks of treatment suggest ongoing stress, infection, or non adherence. Hemoglobin levels signal anemia recovery, especially important in addiction recovery where malnutrition is common. Rising hemoglobin typically appears within four to six weeks of improved nutrition and supplementation.
Respiratory function tests, including forced expiratory volume and oxygen saturation, track lung recovery. Oxygen saturation below 92 percent at rest flags respiratory compromise that requires clinical review. Serial pulmonary function testing at baseline, three months, and six months documents improvement in conditions like chronic obstructive pulmonary disease or post COVID recovery.
Biological trends allow early detection of deterioration before symptoms worsen. A single abnormal lab result may reflect normal variability, but two consecutive results moving in the wrong direction signal the need to adjust treatment. Combining clinical markers with functional and self report data builds a complete recovery profile that guides safer, more responsive care.
Addiction Recovery Progress Indicators Based on Validated Research

Addiction recovery indicators extend beyond substance use to encompass emotional stability, social reintegration, and lifestyle restructuring. The Delphi study identified 28 indicators spanning these domains, with 27 achieving mean importance scores of 7 or higher by the final round. People with lived recovery experience rated coping ability, honesty, law abiding behavior, and treating others with respect significantly higher than clinicians and non practitioners. This shows that those who’ve walked the path prioritize character and relational repair alongside abstinence.
“Not using street drugs” and “coping with problems without turning to drugs or alcohol” both ranked highly among people in recovery, underscoring that avoidance alone isn’t enough. New skills must replace old patterns. The relatively low score for “not experiencing cravings” (mean 6.15) reflects the reality that cravings persist for months or years, and success lies in managing them rather than expecting them to vanish.
Fourteen addiction specific indicators organize multidimensional tracking:
- Days of continuous abstinence counted from last use
- Number of relapse episodes within a defined period
- Reduction in craving intensity and frequency over rolling weeks
- Application of harm reduction strategies when cravings spike
- Engagement in mutual support meetings or peer recovery groups per week
- Completion of assigned recovery homework, such as worksheets or reflections
- Honest disclosure of struggles or lapses during check ins
- Treating family and friends with respect, tracked through observed interactions or family reports
- Law abiding behavior, including absence of arrests or legal violations
- Financial stability, measured by ability to meet basic expenses without illegal activity
- Avoidance of people, places, and situations that trigger use
- Participation in meaningful activities unrelated to substance use
- Progress on personal recovery goals set at intake or during treatment
- Willingness to help and support others in recovery
Interpreting these indicators requires context. A single lapse after 90 days doesn’t erase progress if you re engage quickly, apply new coping tools, and learn from the episode. Conversely, stable abstinence with deteriorating relationships or mental health signals incomplete recovery. Tracking across domains reveals whether you’re building a life worth living, not just avoiding substances.
Interpreting Recovery Progress Indicators and Recognizing Setbacks

Interpreting recovery indicators means looking at trends over time, not reacting to single data points. A bad day shows up as a spike. A bad week starts forming a pattern. A bad month demands a deeper look at what changed and why. Trends over four to twelve weeks carry more weight than isolated readings, especially for self reported mood, cravings, or pain levels, which fluctuate naturally.
Meaningful change thresholds help separate signal from noise. A five point drop in PHQ-9 depression scores is clinically meaningful, while a one or two point shift might reflect normal day to day variation. Similarly, three consecutive weeks of missed appointments or declining attendance rates below 75 percent signal disengagement more reliably than one canceled session. Setting numeric thresholds in advance, such as “two weeks of worsening scores triggers a care plan review,” removes guesswork and ensures timely intervention.
Eight deterioration signals warrant immediate attention and possible escalation:
- Two or more consecutive increases in validated symptom scales like PHQ-9 or GAD-7
- Three or more missed appointments or therapy sessions within a 30 day window
- New or worsening suicidal thoughts or self harm behaviors
- Recurrent relapse within 30 to 90 days of the last episode
- Significant weight loss, gain, or sudden change in appetite without medical explanation
- Decline in physical function tests, such as reduced gait speed or grip strength over two consecutive measurements
- Reports of increased social isolation or loss of housing, income, or key relationships
- Positive toxicology screens after a period of documented abstinence
Using Recovery Progress Indicators to Guide Personalized Care Plans

Combining subjective and objective indicators builds a foundation for personalized treatment that adapts as recovery unfolds. Someone who reports feeling better but shows declining attendance, worsening lab results, or slipping function needs a plan adjustment, not reassurance. Conversely, you might feel stuck but demonstrate measurable gains in strength, mood scores, or social engagement. You may simply need time for internal perception to catch up with external progress.
SMART goals translate indicators into actionable milestones. Instead of “improve mood,” a personalized plan might state: “Reduce PHQ-9 score from 15 to 10 within eight weeks by attending weekly therapy, completing daily mood logs, and practicing two coping strategies per high stress day.” Milestone based care plans break recovery into phases. Stabilization, skill building, maintenance. Each with specific indicator targets and reassessment dates at each transition.
Goal attainment scaling quantifies progress on individualized objectives, assigning numeric ratings to outcomes better than, equal to, or worse than expected. This approach respects that recovery looks different for each person while maintaining measurable accountability.
Trend based goal setting uses historical data to set realistic next steps. If you improved gait speed by 0.1 meters per second over the past month, the next goal might target another 0.1 gain in the following four weeks. If craving frequency dropped from daily to three times per week, the updated target could be twice per week within the next cycle. Adjusting goals based on demonstrated progress keeps plans challenging but achievable, reducing frustration and dropout. Regular reviews, monthly for most indicators, weekly during high risk periods, ensure the care plan evolves with you, not against you.
Data Visualization, Reporting, and Digital Tools for Tracking Recovery Indicators

Data visualization transforms raw numbers into patterns you can see at a glance. Line charts plot symptom scores, weight, or craving frequency over weeks, making upward or downward trends immediately visible. Bar charts compare discrete counts, such as weekly therapy sessions attended or days exercised, across months, highlighting consistency or gaps. Progress bars show goal completion percentages, turning abstract targets into concrete visual feedback that motivates continued effort.
Dashboards centralize multiple indicators on a single screen, letting clinicians and patients review physical, emotional, social, and behavioral data together. Effective dashboards prioritize the most actionable metrics at the top, use color coding for thresholds (green for on track, yellow for caution, red for urgent review), and update automatically as new data enters the system.
Wearable devices feed continuous vitals, step counts, heart rate variability, and sleep stages directly into dashboards, reducing manual entry burden and capturing real time patterns that weekly check ins might miss. Telehealth engagement metrics, such as video session attendance, portal logins, and message response times, add another layer, revealing how actively you participate in remote care.
| Visualization Type | Best Use Case |
|---|---|
| Line chart | Tracking continuous metrics over time, such as mood scores, weight, or craving intensity |
| Bar chart | Comparing discrete counts week to week, like meeting attendance or exercise sessions |
| Radar or spider chart | Displaying multi-domain snapshots at monthly or milestone intervals across physical, mental, and social indicators |
Final Words
Start by picking 5 to 10 easy signals you can record each day, like symptoms, routines, mood, and sleep. This article mapped behavioral and psychological markers, physical and functional tests, social and lifestyle signs, and biological markers.
Then watch trends, not single days. Turn patterns into small tests: adjust one habit, track results, and set milestone-based goals. Use simple charts or a tracker to keep it visible.
These recovery progress indicators are clues, not verdicts. Try one change for a week, note what shifts, and keep refining. You’re building useful data and momentum. Keep going.
FAQ
Q: How do you measure progress in recovery?
A: Measuring progress in recovery means tracking trends across physical, emotional, behavioral, and routine areas—pain, sleep, coping, activity, social contact, cravings—and testing small changes while reassessing results regularly.
Q: What are the 5 levels of recovery and the 5 pillars of recovery?
A: The 5 levels of recovery broadly span acute stabilization, symptom management, skill building, reintegration, and sustained maintenance, while five common pillars are physical health, emotional wellbeing, routines, social support, and coping skills.
Q: What are the 4 R’s of recovery?
A: The 4 R’s of recovery are recognize (spot changes), respond (adjust care), recover (restore function), and reintegrate (return to routines and roles), which help guide small, testable steps.