


What if the easiest way to stop guessing about your health is to write things down?
Tracking symptoms to find triggers that matter most turns fuzzy worry into a clear timeline you can test.
When you note what happened before, during, and after a flare, and jot sleep, meals, stress, and where you were, patterns start to appear within weeks.
Those patterns point to small, practical experiments you can try and track, not wild guesses.
This post shows how to log the right details and use them to spot the triggers that actually change your days.
Practical Foundations for Tracking Symptoms to Identify Triggers

Tracking symptoms builds a cause and effect map that makes hidden triggers visible. When you write down what happened before, during, and after a symptom shows up, you’re creating a timeline your memory can’t hold reliably on its own. Over days and weeks, patterns start to emerge from the noise. Repeated links between specific foods and flares, sleep deficits and pain spikes, stress and digestive trouble, or environmental exposures and breathing changes.
This structured record transforms vague suspicions into testable hypotheses and points you toward practical adjustments that reduce how often symptoms appear and how severe they get.
Effective tracking captures a handful of essential fields every time you log. At minimum, write down when the symptom started (date, time, day of week), how intense it felt (use a simple 1 to 10 scale), and how long it lasted. Then add context: what you ate or drank in the prior 24 hours, how much sleep you got the night before, your stress level that day (another 0 to 10 rating), where you were (crowded room, outdoors, work desk), who was with you, and what physical sensations came with the symptom (tension, headache, rapid pulse, stomach tightness). One or two sentences of notes about your thoughts or how you coped round out the entry.
Consistent documentation across six to twelve weeks reveals repeatable patterns. Logging daily or right after an intense episode reduces recall bias. You capture details while they’re fresh instead of reconstructing them days later from fuzzy memory. As weeks pass, you’ll notice clusters. Symptoms that show up every Monday afternoon, flares after meals heavy in dairy, or episodes that follow poor sleep by one day. These recurring connections become the starting point for targeted changes and informed conversations with healthcare providers.
Date and time of symptom onset, including day of week
Severity rating on a 1 to 10 scale for consistent measurement
Duration in minutes or hours from start to resolution
Food and drink consumed in the prior 24 hours, especially unusual items
Sleep quality and quantity the night before the episode
Stress level before and during the symptom, rated 0 to 10
Key Symptom Tracking Elements for Effective Trigger Discovery

Detailed entries matter because triggers rarely act alone. They layer and interact. A food that causes no trouble one day might spark symptoms when combined with poor sleep, high stress, or a crowded environment. Recording all these dimensions lets you spot which combinations reliably precede flares and which variables matter most.
When you track the full context around each episode, you move beyond single cause thinking and start recognizing the conditional patterns that drive your personal symptom landscape. “Headaches after late nights plus skipped breakfast,” not just “headaches sometimes.”
Food, sleep, stress, and environmental context form the backbone of useful tracking. For food, note not just what you ate but when. Timing matters. A meal heavy in refined carbs at 9 p.m. might disrupt sleep, which then contributes to next day brain fog or irritability. Sleep entries should include both duration (hours) and quality (restless, waking, deep). Stress ratings capture your baseline entering the day and any spikes tied to specific events.
Environmental details often reveal sensitivities that stay invisible without deliberate logging. Scent from cleaning products, noise in a café, pollen count, temperature swings, fluorescent lighting. Example: “Stomach cramping, 7/10 severity, started 45 minutes after lunch. Ate: grilled chicken wrap with dairy cheese, iced coffee. Slept 6 hours, restless. Stress 6/10 all morning (deadline pressure). Location: noisy open plan office.”
Tracking emotional and physical sensations uncovers hidden influences. Emotions like irritability, anxiety, or sudden sadness can precede or accompany physical symptoms and may signal the body’s early response to a trigger. Physical sensations (tight shoulders, shallow breathing, cold hands, a knot in your stomach) often appear before you consciously register distress. Logging these alongside your main symptom helps you recognize early warning signs and refine your understanding of how triggers cascade through your system.
A migraine doesn’t start at full intensity. It often begins with neck stiffness or visual static an hour earlier. Catching those precursors in your log trains you to intervene sooner.
Daily logs and episode based entries serve different needs. Daily logs work best when symptoms fluctuate every day or when you’re hunting for subtle patterns across many variables (fatigue levels, mood shifts, minor digestive changes). They create a complete baseline and make it easy to correlate non events (“no symptoms today”) with what you did differently.
Episode based entries make sense for infrequent but intense symptoms. Migraines every few weeks, asthma flares, severe pain episodes. Log the moment it starts and add detail while it’s happening, then note the resolution. For conditions in between, try brief daily check-ins (two sentences, key numbers) plus expanded entries on flare days.
Date, time, and day of week to identify temporal patterns
Symptom type and severity rated on a 0 to 10 numeric scale
Duration from onset to resolution, recorded in minutes or hours
Food and beverages consumed in the prior 24 hours
Sleep duration and quality from the previous night
Stress level rated 0 to 10 before and during the episode
Environmental context including location, noise, scent, people present
Physical sensations and emotional state at onset and throughout
Methods and Tools for Tracking Symptoms and Triggers

Paper journals and digital logs each offer distinct advantages. Paper gives you full control over format. You can sketch timelines, draw icons for symptom intensity, or scribble quick margin notes without navigating menus. It’s tactile, private, and never runs out of battery.
Digital tools (apps, spreadsheets, note taking software) automate parts of the process with built in reminders, date stamps, and data export. They make it easier to filter entries (“show me all days stress was above 7”), generate trend graphs, and share summaries with clinicians without retyping. Choose the method that feels frictionless for your routine. The best tracker is the one you’ll actually use every day.
Symptom tracking apps streamline logging by prompting you at set times and offering pre built rating scales. Many let you add custom fields, attach photos (useful for skin conditions), and create visual reports. Apps designed for specific conditions (migraine trackers, IBS logs, pain diaries) often include relevant environmental fields and can correlate entries with weather data or menstrual cycles automatically.
Spreadsheets offer similar flexibility with more manual setup. Build a simple table with columns for date, symptom, severity, food, sleep, stress, and notes. Both approaches support sorting, filtering, and pivot analysis once you’ve gathered several weeks of data.
Wearable devices add objective metrics that reduce reliance on memory and perception. A fitness tracker or smartwatch logs sleep stages, resting heart rate, step counts, and sometimes heart rate variability. All useful for spotting physiological patterns around symptom days.
When you pair wearable data with your manual symptom log, you can check whether flares consistently follow nights with low deep sleep percentages or elevated overnight heart rates. Wearables won’t capture every trigger, but they fill in the baseline activity and recovery picture, especially for fatigue, pain, and mood related symptoms.
| Method | Best Use Case | Limitations |
|---|---|---|
| Paper journal | Flexible format, tactile experience, full privacy, no tech barriers | No automatic reminders, no built in analytics, harder to share with clinicians |
| Symptom tracking app | Automated reminders, pre built scales, easy trend graphs, data export | Learning curve, potential cost, privacy concerns, limited customization |
| Spreadsheet | Full control over fields, sorting and filtering, free or low cost | Manual setup required, no built in reminders, steeper learning curve for analysis |
| Wearable device | Objective sleep, heart rate, activity data; automatic collection | Doesn’t capture food, environment, or subjective symptoms; requires pairing with manual log |
Analyzing Symptom Patterns to Reveal Triggers

Simple Manual Analysis Techniques
Weekly or monthly review sessions transform scattered entries into insights. Set aside 15 to 30 minutes at the end of each week to read through your logs and look for repeated connections. Mark or highlight episodes that share common features. Same day of the week, similar food, consistent sleep deficit, identical environmental setting.
Color coded calendars make clusters visible at a glance. Use one color for high severity days, another for low sleep nights, and a third for high stress periods. When colors overlap regularly, you’ve found a probable trigger combination. Simple timelines drawn on paper or in a digital note can show how symptoms lag behind events by hours or days. Many food triggers take 12 to 48 hours to produce digestive or skin symptoms, and sleep debt often manifests the day after.
Start with frequency counts and basic correlation spotting. Tally how many episodes occurred on Mondays versus weekends, after dairy versus after gluten free meals, following seven plus hours of sleep versus five or fewer. If 70 percent of your migraines happen within 24 hours of poor sleep, that’s a strong signal.
Compare symptom severity against stress ratings. Do 8/10 pain days cluster when stress was also 7 or above? Look for “never” patterns too. Symptoms that rarely or never appear when a certain variable is absent. These negative correlations (“no flares on days I skip coffee”) are just as informative as positive ones.
Digital Tools and Automated Pattern Detection
Apps and spreadsheets with charting features generate visual trend lines, bar graphs, and heatmaps that make patterns jump out without manual tallying. Export your data to a spreadsheet and create pivot tables or simple line charts plotting symptom severity over time, with separate lines or markers for sleep, stress, and key foods.
Many symptom apps offer built in analytics. Rolling seven day averages smooth out day to day noise and highlight whether symptoms are trending up, down, or stable. Cross tab analyses (tables that show symptom severity broken down by two variables at once, like sleep quality × stress level) reveal interaction effects that single variable views miss.
Automated pattern detection tools use algorithms to flag recurring associations and suggest potential triggers based on your log history. Some apps will alert you when a symptom consistently follows a specific food or activity within a defined time window.
While helpful, treat these suggestions as hypotheses to test, not final answers. Algorithms can’t know your full context. Use the digital summaries to guide targeted experiments. If the app flags “high severity episodes correlate with <6 hours sleep,” plan a two week trial with seven plus hours and compare results.
Food and beverages, especially common allergens, caffeine, alcohol, high FODMAP items, and processed additives
Sleep deprivation or disrupted sleep, including late bedtimes, waking frequently, or poor sleep quality
Psychological stress, whether acute (deadline, conflict) or chronic (ongoing worry, caregiving load)
Weather and atmospheric changes, such as barometric pressure shifts, humidity, temperature swings
Environmental allergens and irritants, including pollen, dust, mold, pet dander, smoke, strong scents
Hormonal cycles, particularly menstrual phases, ovulation, or perimenopause fluctuations
Physical exertion or inactivity, whether overtraining, sudden intensity changes, or prolonged sedentary periods
Condition Specific Approaches to Trigger Identification
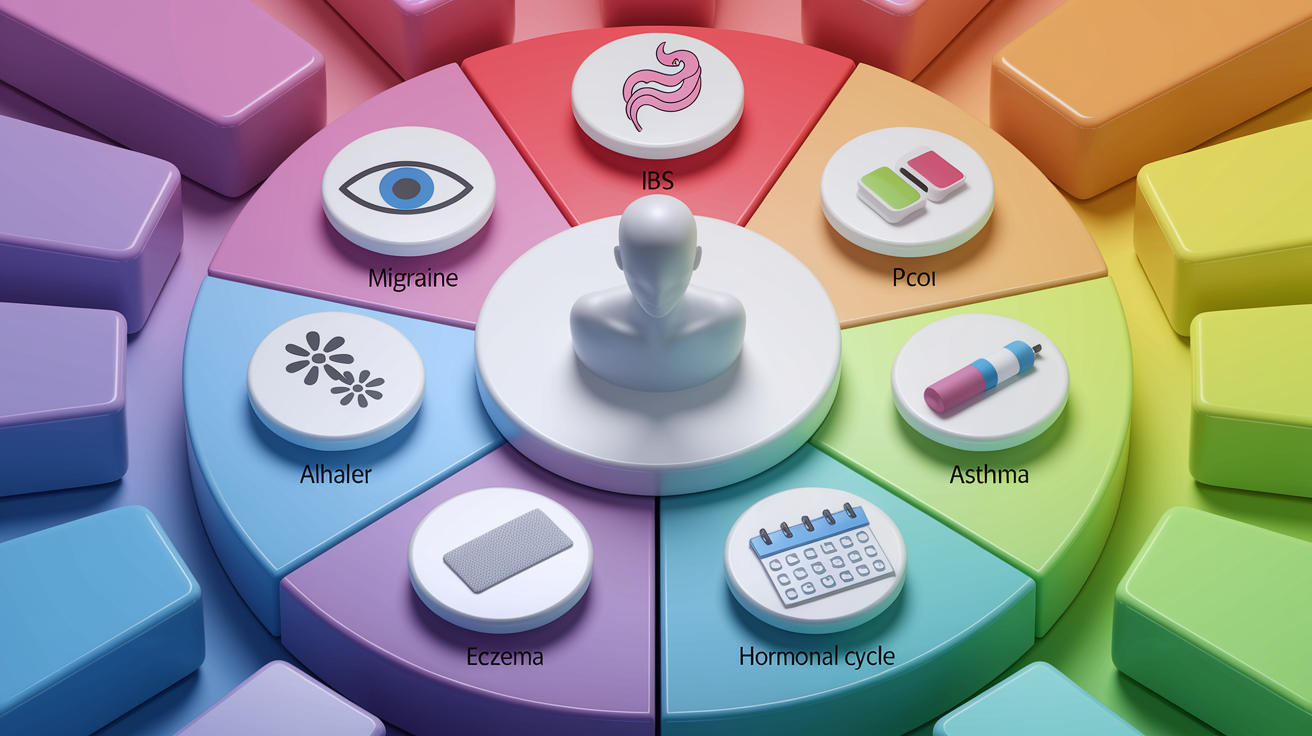
Migraine tracking benefits from logging the hours leading up to headache onset, not just the moment pain starts. Record sleep duration and quality the previous night, meals and snacks in the 24 hours before, caffeine and alcohol intake, screen time, bright or flickering lights, strong scents, weather changes, and stress levels throughout the day.
Many migraine sufferers find triggers cluster. Skipping breakfast plus poor sleep plus a weather front often sparks a migraine when any one factor alone might not. Track aura symptoms separately (visual disturbances, tingling, nausea) because they can appear 30 to 60 minutes before head pain and help you recognize early warning signs. Use a 0 to 10 scale for both pain intensity and functional impact (can you work, drive, tolerate light and sound).
IBS and digestive symptom tracking requires close attention to meal timing, portion size, and specific food components. Note not just what you ate but when. Symptoms often lag meals by several hours. Track bowel movements (frequency, consistency using the Bristol Stool Chart), abdominal pain or cramping (location and severity), bloating, gas, and urgency.
Record stress and mood alongside food because gut symptoms are highly sensitive to the gut brain axis. Many people with IBS benefit from a structured elimination approach. Remove high FODMAP foods for four weeks while logging, then reintroduce one group at a time and watch for symptom return. This targeted method turns your log into a controlled experiment and isolates which carbohydrate categories drive your symptoms.
Allergy and environmental sensitivity logs emphasize context and exposures. Track location (indoors, outdoors, specific rooms), air quality, pollen forecasts if available, presence of pets, cleaning products used, personal care products (lotions, perfumes), and proximity to smoke or strong odors.
Symptoms to log include sneezing, congestion, itchy eyes, throat irritation, skin reactions, and respiratory changes. Time your entries to capture how quickly symptoms appear after exposure and how long they persist after leaving the environment. For contact dermatitis or eczema, photograph affected skin and note any new products, fabrics, or materials you touched that day.
Asthma, eczema, and chronic pain tracking overlaps with the approaches above but adds condition specific metrics. Asthma logs should include peak flow readings if you use a meter, inhaler use (rescue and maintenance), breathing effort (0 to 10), cough frequency, and nighttime awakenings.
For eczema, document flare locations, itch intensity, skin moisture, and any topical treatments applied. Chronic pain logs benefit from tracking pain location (use a body map or list), quality (sharp, dull, burning, throbbing), movement limitations, and activities that worsen or ease pain. All three conditions respond to stress, sleep, and environmental factors, so maintain those core fields alongside condition specific measures.
Menstrual cycle and hormonal trigger tracking requires logging your cycle phase (menstruation, follicular, ovulation, luteal) alongside symptoms. Many conditions (migraines, mood shifts, digestive changes, pain flares, skin breakouts) follow predictable patterns tied to estrogen and progesterone fluctuations.
Use a period tracking app or mark cycle days manually in your symptom log (day 1 = first day of bleeding). Over three to six months, you’ll see whether symptoms cluster in the luteal phase (week before period), around ovulation, or during menstruation itself. This temporal pattern helps validate hormonal triggers and guides timing of interventions. Adjusting medication, scheduling rest, or planning around predictable flare windows.
Case Studies Showing How Symptom Tracking Reveals Triggers

A 34 year old tracked daily headaches for eight weeks, logging sleep, meals, stress, and screen time. After four weeks, a pattern emerged. Every headache rated 6 or higher occurred within 36 hours of sleeping fewer than six and a half hours. Nights with seven plus hours rarely preceded significant pain.
She tested the hypothesis by prioritizing sleep for two weeks. Headache frequency dropped from five per week to one or two, and severity stayed below 4. The log also revealed that skipping breakfast amplified headache risk on short sleep days, turning a suspicion into a clear two variable trigger she could address with both better sleep hygiene and morning routine adjustments.
A 29 year old with recurring digestive distress logged meals, stress, and GI symptoms (cramping, bloating, urgency) for ten weeks. Initially, no single food stood out. During week six, he noticed that severe symptoms appeared almost exclusively on high stress workdays, regardless of diet.
He started rating stress hourly on flare days and discovered that afternoon meetings triggered a predictable cascade. Stress climbed, then stomach cramping began 30 to 90 minutes later. The tracking helped him connect the gut brain link and led to trying brief mindfulness breaks before stressful events. Symptom intensity decreased even when diet stayed constant, confirming stress as the primary driver.
A 42 year old logged joint pain, weather data, and activity for 12 weeks to identify arthritis flare triggers. She found that pain spiked reliably 12 to 24 hours after barometric pressure dropped more than 0.2 inches, especially when combined with outdoor exercise in cold, damp conditions. On stable weather days, similar exercise intensity caused minimal discomfort.
The log allowed her to plan rest or indoor workouts around weather forecasts and adjust expectations rather than blaming random bad luck. Tracking also revealed that a heating pad within two hours of pressure changes reduced next day severity, a simple intervention she wouldn’t have tested without the pattern data.
Best Practices for Maintaining Consistent and Accurate Symptom Logs
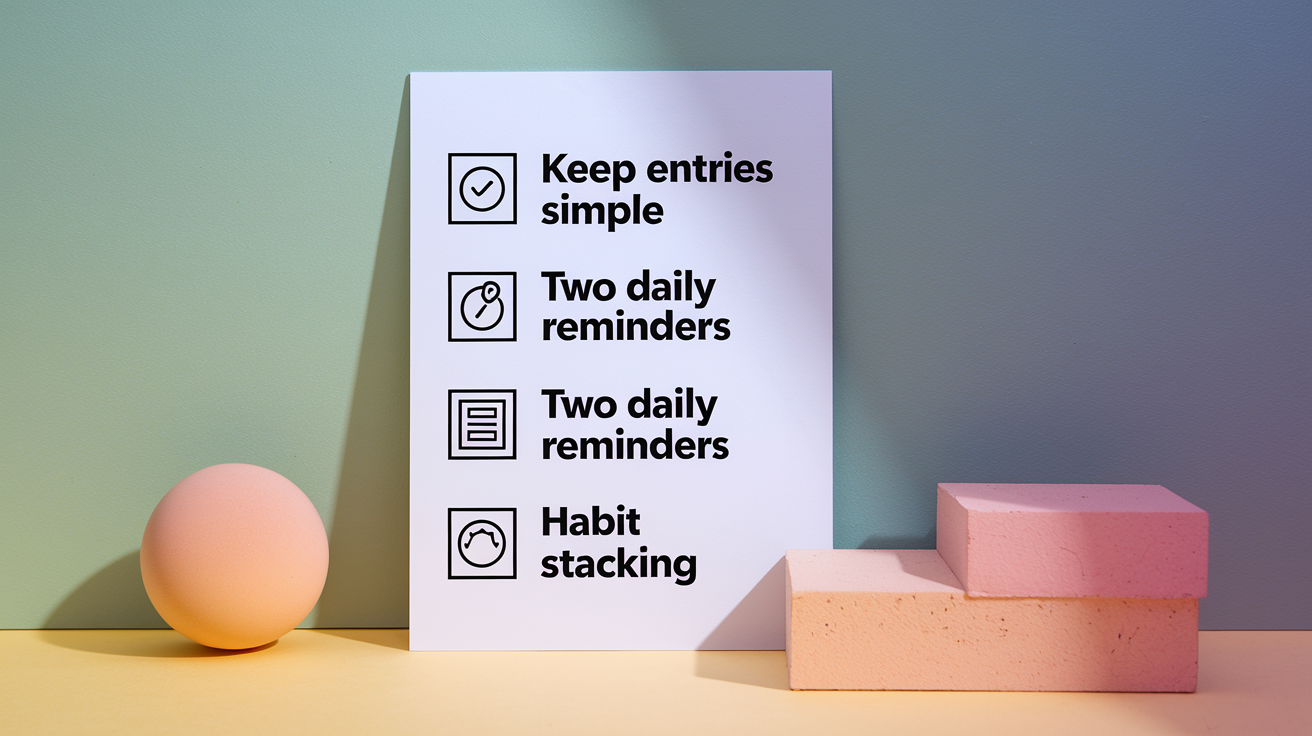
Avoid overwhelm by limiting what you track to the essentials that actually inform decisions. Start with three to five core fields (date, symptom severity, one or two likely triggers like food, sleep, stress) and expand only if those aren’t revealing patterns.
Tracking 15 variables every day sounds thorough but usually leads to burnout and abandoned logs within two weeks. Keep entries quick. 60 to 90 seconds per log, twice a day if possible (morning and evening). The goal is sustainable routine, not exhaustive documentation. If tracking starts feeling like a burden, scale back or take a planned break rather than quitting entirely.
Reduce recall bias by logging in real time or as close to the event as possible. Memories blur within hours, and you’ll forget whether stress was a 5 or a 7, or whether the headache started at 2 p.m. or 4 p.m.
Set two daily reminders. One in the morning to capture yesterday’s sleep and today’s baseline, one in the evening to log the day’s events and any symptoms. If an intense symptom appears mid day, jot a quick note immediately (even a voice memo or text to yourself) and expand it into a full entry later. Real time entries are more accurate and less mentally taxing than trying to reconstruct three days’ worth of details during a weekly review session.
Build a routine by linking tracking to an existing habit you already do every day. Log right after brushing your teeth, during your morning coffee, or while waiting for your phone to charge at night. Habit stacking makes the behavior automatic instead of something you have to remember independently.
Use app reminders or calendar alerts until the routine sticks, then let the habit itself become the cue. If you miss a day, don’t try to backfill from memory. Just resume the next day. Consistency over weeks matters far more than perfection.
Set two daily reminders at consistent times (morning and evening) to prompt logging.
Link tracking to an existing habit like brushing teeth, taking medication, or making coffee.
Keep entries short, aim for 60 to 90 seconds per log to maintain momentum.
Use a simple template (paper or digital) so you never face a blank page.
Review weekly, not daily, to spot patterns without obsessing over individual days.
Using Symptom Data in Medical Appointments and Next Steps After Identifying a Trigger

Prepare a one page summary of your tracking findings before any appointment. Clinicians appreciate concise trend descriptions more than raw data dumps. Write a few sentences explaining the pattern you found (“Migraines occur 70 percent of the time within 24 hours of less than six hours of sleep, especially when combined with skipped meals”) and bring a simple chart or graph if your app or spreadsheet generates one.
Note when symptoms started or changed, the typical severity range (include your scale), how often episodes occur per week or month, and what you’ve already tried. This functional impact framing helps your provider understand urgency and guides diagnostic or treatment decisions.
Ask informed questions based on your tracked patterns. Instead of “Why do I get headaches?” try “My log shows headaches cluster after poor sleep and high stress days. Could this be tension type headaches, and are there preventive strategies beyond better sleep hygiene?”
If you’ve identified a suspected food trigger, ask whether an elimination trial or formal allergy testing makes sense. If environmental exposures correlate with respiratory symptoms, inquire about allergen testing or referral to a specialist. Your tracked data turns vague complaints into specific, testable hypotheses that make clinical conversations more productive and collaborative.
After identifying a suspected trigger, test it with a structured avoidance or reintroduction trial. Remove the trigger completely for two to four weeks while continuing to log symptoms at the same level of detail. If frequency or severity drops significantly, you’ve likely found a real contributor.
Then reintroduce the trigger deliberately and watch whether symptoms return within the expected timeframe (hours for some foods and scents, days for sleep or stress effects). This N of 1 experiment (using yourself as both subject and control) validates or refutes your hypothesis and gives you confidence to make lasting changes.
| Action Step | Purpose | Recommended Duration |
|---|---|---|
| Elimination (remove suspected trigger) | Establish whether removing the variable reduces symptom frequency or severity | 2 to 4 weeks |
| Reintroduction (add trigger back deliberately) | Confirm causation by observing whether symptoms return after re exposure | Single exposure, then monitor for 24 to 72 hours |
| Monitor response (continue logging during both phases) | Maintain baseline tracking to detect changes and rule out coincidence or other variables | Entire elimination and reintroduction period |
Final Words
Start tracking with a simple log: note time, a 1–10 severity, how long it lasted, recent food, sleep, stress, and where you were. Do this daily or after episodes for 6 to 12 weeks so small patterns can appear.
Do a quick weekly review, look for repeat pairs like poor sleep and worse symptoms, and run a short test. Avoid the suspect for 2 to 4 weeks and see what changes.
Sharing clear notes helps clinicians, and tracking symptoms to find triggers is a doable experiment that often leads to clearer answers and better days ahead.
FAQ
Q: What are two of the 10 symptoms you should never ignore?
A: Two of the 10 symptoms you should never ignore are sudden chest pain or pressure (possible heart attack) and sudden weakness, numbness, or slurred speech (possible stroke). Seek emergency care immediately.
Q: What is ADHD symptom tracking?
A: ADHD symptom tracking is recording attention, impulsivity, hyperactivity, sleep, routines, and medication effects over time using simple scales or notes to spot patterns and guide treatment decisions.
Q: How to track your symptoms?
A: To track your symptoms, note time, severity (0–10), duration, food, sleep, stress, environment, medications, and sensations; use daily or episode logs for 6–12 weeks, then review weekly for repeatable patterns.
Q: Is there an app to track autoimmune symptoms?
A: There are apps to track autoimmune symptoms; try Flaredown, Cara Care, or Symple for logging severity, triggers, meds, and exporting charts to share with clinicians. Pick one with reminders and charts.