


Think you’re drinking enough? Most people aren’t, and you don’t need a clinic to find out.
Your body sends clear signals, like urine shade, a thirsty mouth, and how often you pee, and a few quick checks take about thirty seconds.
This post walks you through simple, reliable home tests, what each result usually means, and small next steps you can try right away.
Use this short checklist each morning and you’ll spot real patterns instead of guessing.
Immediate Methods to Check Hydration Status at Home

Your body’s already telling you about hydration. You just need to know what to look for, and it takes about thirty seconds.
Most people go straight to urine color, which shifts from pale straw when you’re hydrated to dark amber when you’re not. Check your first-morning urine for the cleanest read, since overnight your kidneys concentrate waste without any meals or drinks getting in the way. If your urine lands in the 1–3 range on a standard color chart (pale yellow to light yellow), you’re probably fine. Colors 4–6 mean mild to moderate dehydration. Anything at 7 or darker? You need fluids now.
But don’t stop there. Combine these six indicators for a fuller picture:
- Urine color pale straw to light yellow is what you’re after; dark yellow or amber means dehydration
- Thirst on waking feeling thirsty first thing usually means you ended yesterday dehydrated
- Dry mouth and sticky saliva your mouth should feel moist; if it’s persistently dry, that’s a red flag
- Urination frequency 4 to 8 bathroom trips per day is normal; fewer than 4 suggests low fluid intake
- Skin turgor pinch the skin on your forearm and let go; it should snap back in under 2 seconds
- Dizziness or fatigue lightheadedness when you stand or unexplained tiredness can point to fluid deficit
Run through this list each morning before coffee. If two or more indicators suggest dehydration, drink a full glass of water and check again an hour later. For a validated step-by-step method used by athletes and researchers, see How to Accurately Assess Hydration Status Using Urine Color Charts.
Using Urine Color Charts to Determine Hydration Status
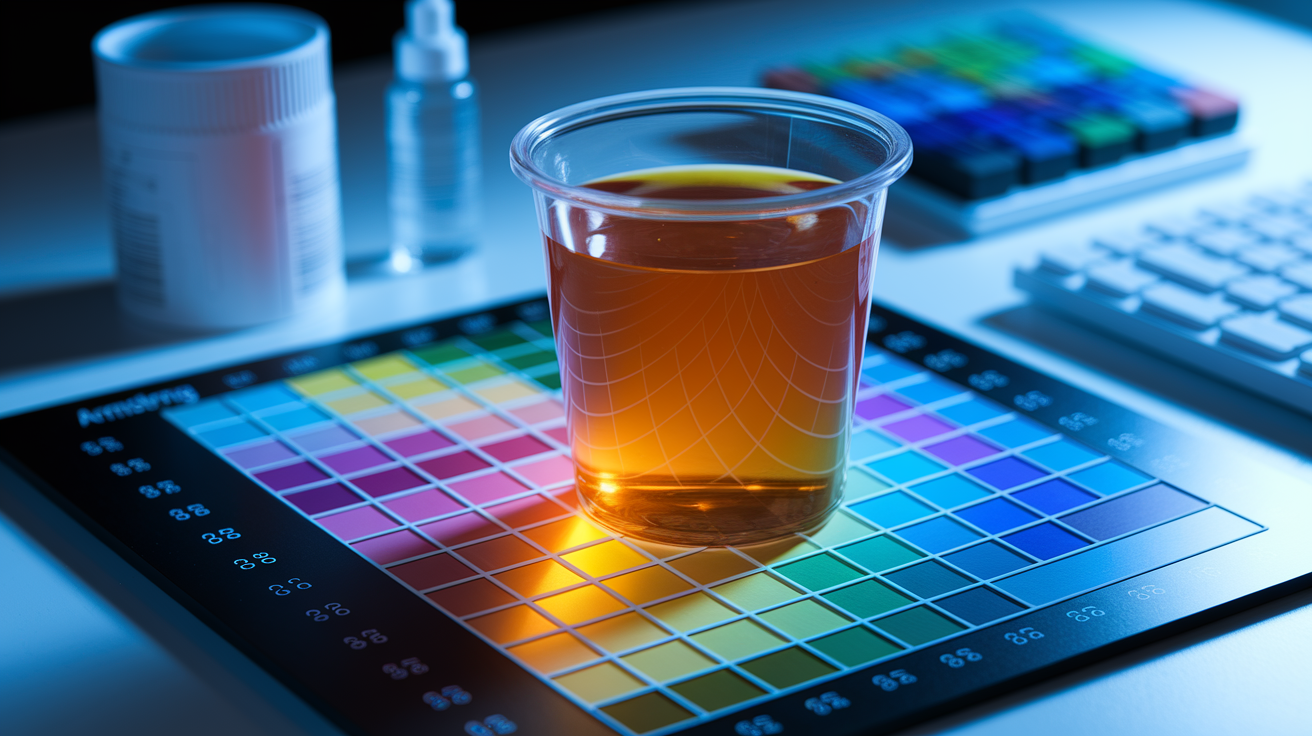
Validated urine color charts turn the shade of your urine into a hydration score. They work best when you follow the exact method each chart was built for. Three research-backed charts are in wide use today, each validated in a specific setting with specific collection steps. Use the wrong chart for your situation or skip the collection details, and you’ll throw off your reading.
The charts range from 3 to 8 colors. Each assigns a number so you can track changes over days or weeks. All validated charts share one principle: lighter shades (1–3) mean you’re well hydrated, middle shades (4–6) suggest mild to moderate dehydration, and dark shades (7 or higher) mean you need fluids soon. But how you collect and compare your urine sample matters just as much as the chart itself.
Armstrong 8‑Color Chart
Developed and validated in 1994, the Armstrong chart displays eight standardized shades from pale yellow to dark green. It was validated for urine collected in a clear cup, not for urine diluted in a toilet bowl. To use it correctly, collect about 30 mL of urine in a transparent container, then compare the sample to the chart under consistent lighting. A small LED flashlight pointed at the chart and sample helps standardize conditions and reduces errors from dim bathroom lights or bright sunlight. This chart is the oldest validated tool and gets cited in research constantly, but its accuracy depends entirely on using a cup and standardized lighting like the original study did.
Wardenaar 7‑Color Chart
Validated in 2019, this chart refined the Armstrong model into seven shades ranging from very light yellow to deep amber. Like Armstrong’s version, the Wardenaar 7-color chart requires urine collected in a clear cup, with about 30 mL of sample volume. Use an LED flashlight to light both the chart and the sample evenly, then match the sample color to the closest chart shade. The 7-color gradient was designed to reduce ambiguity between adjacent shades, making it a bit easier to pick the right number. This chart is valid only for cup-based assessment. Don’t use it to compare urine in a toilet bowl. For detailed instructions and access to validated charts, visit How to Accurately Assess Hydration Status Using Urine Color Charts.
Wardenaar 3‑Color Lavatory Chart
Validated in 2021 specifically for urine diluted in a toilet bowl, this chart solves the problem of assessing hydration when you can’t or don’t want to collect a cup sample. The chart displays three reference colors, and you select the correct one by timing your urine stream in seconds. Once you’ve picked the reference color that matches your stream duration, compare that reference to the color of your urine in the toilet bowl. This method was validated for this exact setting, so it’s the only chart you should use when assessing diluted urine. The 3-color approach is simpler and faster than cup-based methods, but it trades some detail for convenience. If you need detailed daily tracking, cup-based charts give you more sensitivity to small hydration changes.
Objective Hydration Measurements for More Accurate Assessment
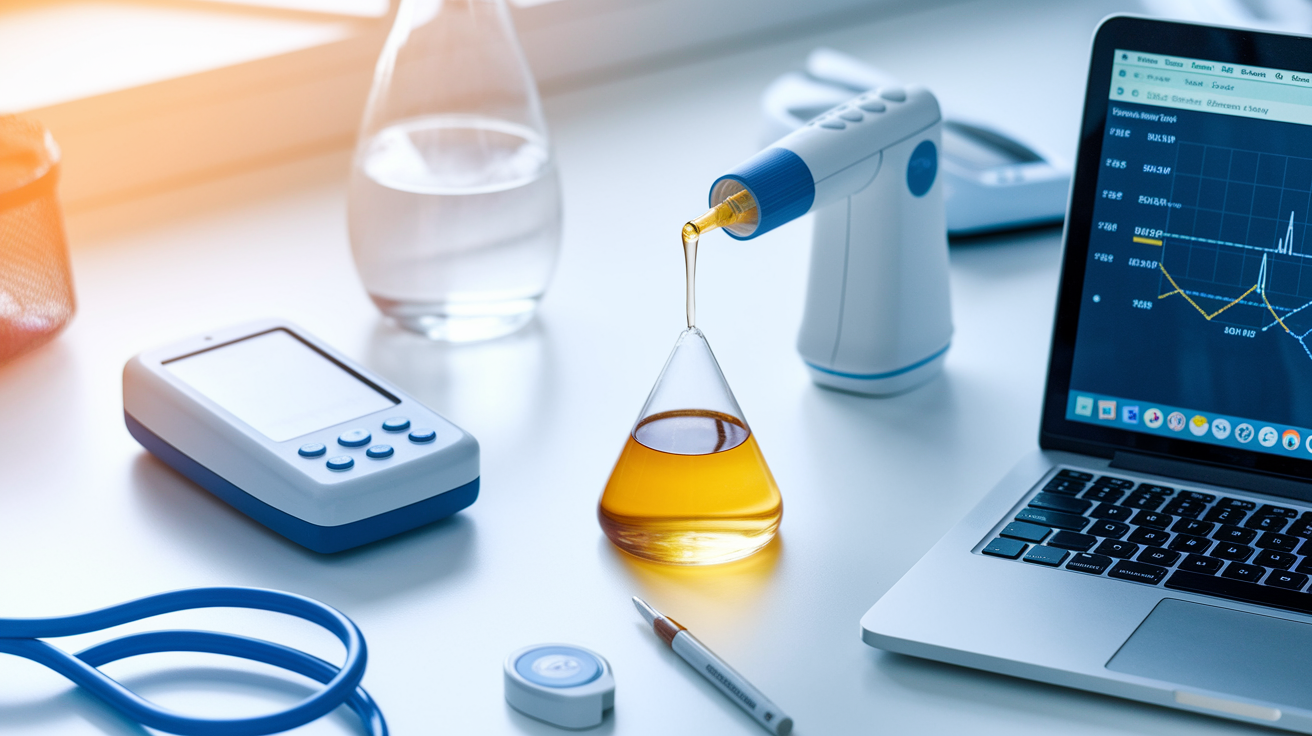
When you need numbers instead of visual estimates, objective measurements provide thresholds you can track and share with a coach, dietitian, or clinician. These methods require simple tools or lab access, and they remove most of the guesswork that comes with subjective signs like thirst or fatigue.
Urine specific gravity (USG) and urine osmolality quantify how concentrated your urine is, offering a direct look at kidney function and fluid balance. Body weight changes before and after activity reveal fluid losses through sweat. Bioelectrical impedance analysis (BIA) devices estimate total body water by passing a small current through your body. Each method has trade-offs in cost, convenience, and precision, so pick the one that fits your access and goals.
| Method | Normal Range | Dehydration Indicator | Notes |
|---|---|---|---|
| Urine Specific Gravity (USG) | ≤1.020 | >1.020–1.025 | Measured with refractometer or dipstick; consistent AM timing preferred |
| Urine Osmolality | <500 mOsm/kg | >800 mOsm/kg | Lab test; more precise than USG but requires sample submission |
| Serum Osmolality | 275–295 mOsm/kg | >295 mOsm/kg | Blood test; best for clinical assessment of fluid and electrolyte balance |
| Bioelectrical Impedance (BIA) | Device-dependent | Device-dependent | Home or clinic scale; estimates total body water; less precise than lab methods |
USG is the most practical objective measure for home or field use. You can buy a handheld refractometer online for about the price of a good water bottle, and it delivers a result in seconds. Collect a first-morning urine sample in a clean container, place a drop on the refractometer’s prism, close the cover, and read the number on the scale. Values at or below 1.020 generally indicate adequate hydration. Readings above 1.020 suggest your kidneys are conserving water. Urine osmolality offers greater precision but requires lab analysis, so it’s better suited for clinical settings or formal research protocols. BIA devices are convenient and provide trends over time, but they can be thrown off by recent meals, exercise, and skin moisture. Use them as a rough guide rather than a definitive answer.
Hydration Status Monitoring for Athletes and Active Individuals
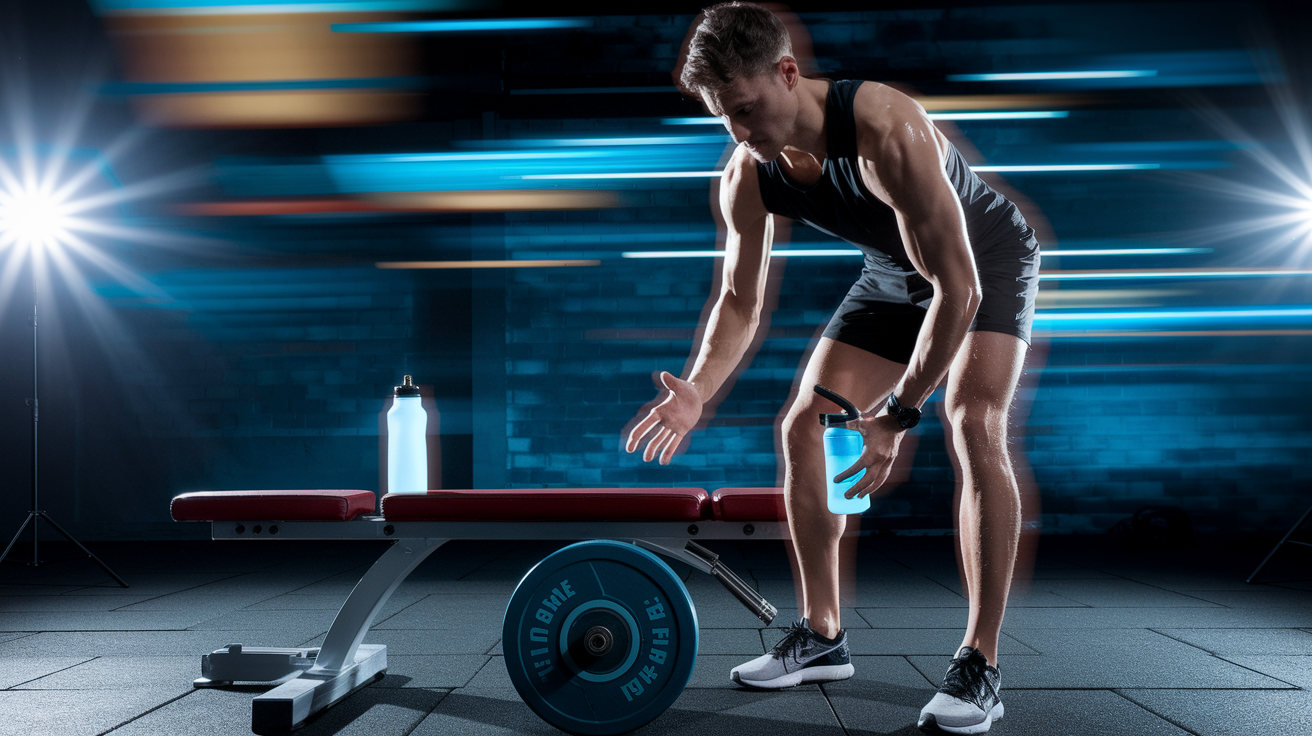
Athletes lose fluid through sweat at rates that vary wildly by intensity, environment, and individual physiology. Checking hydration before and after training sessions reveals patterns that generic advice can’t capture. A structured monitoring protocol helps you spot trends, adjust fluid intake, and avoid both dehydration and overhydration during hard efforts.
The simplest athlete-focused method is the WUT system: Weight, Urine color, and Thirst, all assessed first thing in the morning before eating, drinking, or using the bathroom. If your body weight has dropped more than 2 percent from your normal baseline, add one point. If your first-morning urine is dark (color 4 or higher on a standard chart), add one point. If you wake up thirsty, add one point. A total score of 0 or 1 means you’re likely well hydrated and ready for a normal training load. A score of 2 suggests mild dehydration and may warrant adjusting your fluid or electrolyte intake and dialing back intense intervals for the day. A score of 3 means you’re very likely dehydrated, and you should focus on rehydration before any strenuous session that causes large sweat losses. For detailed guidance on applying this system, see How to tell if you’re dehydrated.
Beyond the morning check, weigh yourself before and after key workouts to calculate your sweat rate. Each kilogram of body weight lost during exercise equals roughly one liter of fluid lost through sweat and respiration. If you finish a two-hour ride 1.5 kg lighter, you’ve lost about 1.5 liters, and your sweat rate for that session was approximately 0.75 liters per hour. That number helps you set fluid intake targets for similar sessions in the future. Research shows that performance often declines once body weight loss exceeds 2 percent, though individual tolerance varies. Replace about 150 percent of the fluid you lost after exercise to account for ongoing losses through urine and breathing. For example, if you lost 1 kg, aim to drink around 1.5 liters over the next few hours.
Follow these five steps for session-by-session hydration tracking:
- Weigh yourself naked or in minimal clothing before exercise record to the nearest 0.1 kg if possible.
- Complete your workout and note fluid intake during the session track what you drank in milliliters.
- Weigh yourself again immediately post-exercise in the same clothing subtract post-weight from pre-weight to find fluid loss.
- Check urine color and thirst level post-session colors 1–3 and no strong thirst suggest good fluid replacement; darker colors or persistent thirst mean you need more.
- Log the data and adjust your hydration plan if you consistently finish sessions with significant weight loss or dark urine, increase fluid or electrolyte intake during the next session.
Sodium plays a key role in helping your body retain the fluids you drink. In a 2015 study of athletes racing a hot Ironman 70.3 event, those who consumed sodium during the race lost less body weight and finished an average of 26 minutes faster than athletes given a placebo. Experiment with electrolyte drinks or sodium capsules during training, and consider sweat sodium testing if you’re a heavy or salty sweater (white streaks on clothing after exercise are a clue). Use a hydration planner to estimate fluid and sodium needs, then refine targets through trial and error in training sessions that mimic race conditions.
Clinical Signs and Vital Assessments for Hydration Status

Healthcare providers and caregivers use physical exam findings and vital sign changes to assess hydration when lab tests aren’t immediately available or when rapid bedside evaluation is needed. These clinical indicators help determine whether someone needs oral rehydration, intravenous fluids, or urgent medical attention.
Orthostatic vital signs measure how your blood pressure and heart rate respond when you move from lying down to standing. In a well-hydrated person, these values shift only slightly. A drop in systolic blood pressure of 20 mmHg or more, or a heart rate increase of more than 20 beats per minute, suggests significant fluid loss and reduced blood volume. To perform this check, have the person lie flat for three to five minutes, measure blood pressure and heart rate, then have them stand and remeasure within one minute. Capillary refill time is another quick bedside test: press on a fingernail or the pad of a finger until it blanches, then release and count how long it takes for color to return. Normal refill is under two seconds. Longer times can indicate poor perfusion from dehydration or other circulatory problems.
Check these four clinical indicators when monitoring someone at home or in a care setting:
- Mucous membranes the inside of the mouth and lips should be moist; dry, sticky membranes suggest dehydration.
- Capillary refill time press a fingernail until it turns white, then release; color should return in under 2 seconds.
- Orthostatic blood pressure and heart rate measure lying and standing; significant drops or spikes point to low fluid volume.
- Urine output adults typically produce at least 30 mL of urine per hour (about 0.5 mL per kilogram of body weight per hour); lower output is a red flag.
Track urine output over a 24-hour period when you’re concerned about hydration in someone who is ill, recovering from surgery, or unable to drink normally. Output below 30 mL per hour for several hours running, or a total daily volume well below 800 mL, suggests the kidneys are conserving water and the person needs more fluids. Combine this with other signs like dry mouth, delayed capillary refill, and orthostatic changes to build a complete clinical picture and decide whether to increase oral intake, start rehydration drinks, or seek medical evaluation.
Special Hydration Assessment Considerations Across Ages and Conditions
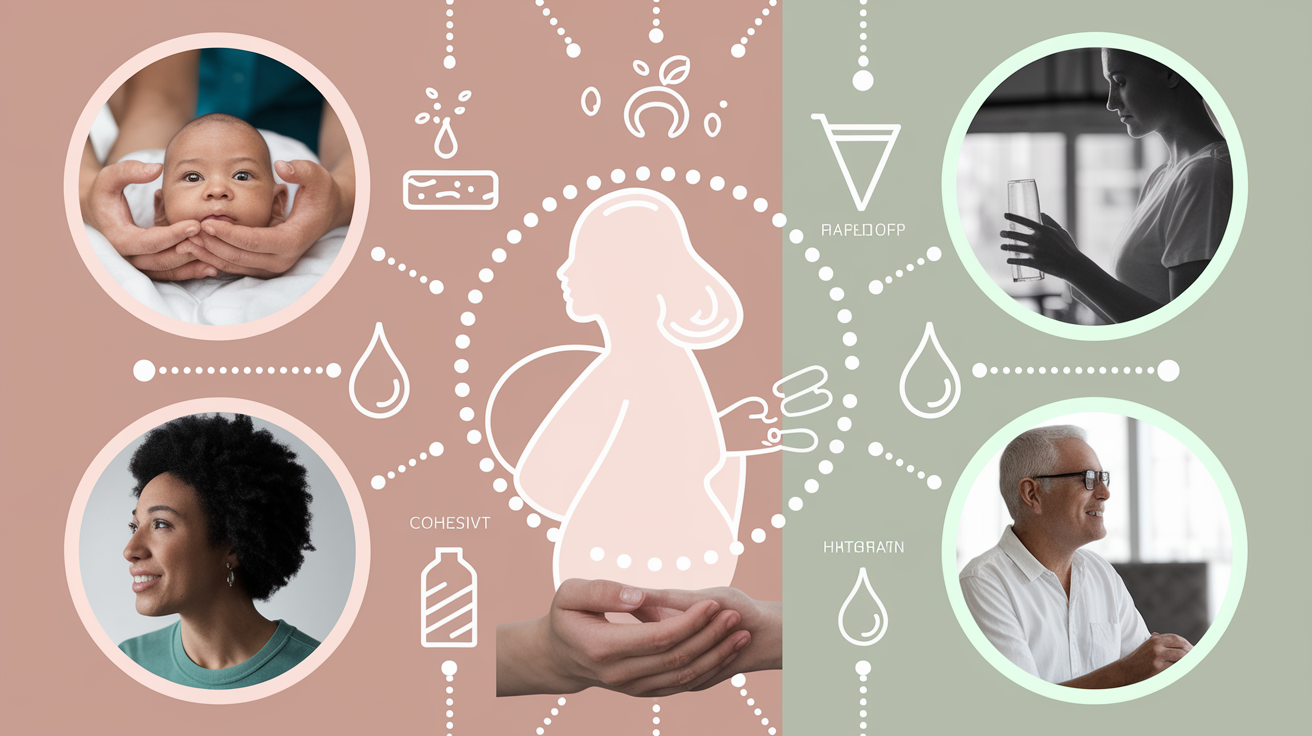
Hydration assessment looks different in infants, older adults, pregnant individuals, and people with chronic health conditions because physiology, fluid needs, and common symptoms all shift. What works for a healthy 30-year-old athlete may miss dehydration in a 75-year-old or misinterpret normal findings in a newborn.
Infants and young children can’t report thirst clearly, so caregivers watch for indirect signs: fewer wet diapers (fewer than six in 24 hours for an infant), sunken eyes, a sunken soft spot on the head, dry mouth and lips, reduced tears when crying, and listlessness or irritability. Skin turgor in babies is checked by gently pinching the skin on the abdomen. It should spring back immediately. Weight loss in infants is particularly concerning because their smaller body size means a small fluid deficit represents a larger percentage of total body water.
Older adults face different challenges. Thirst sensation declines with age, so they may not feel thirsty even when dehydrated. Skin elasticity naturally decreases, making the skin turgor test less reliable. Delayed recoil may simply reflect aging skin rather than true dehydration. Focus instead on urine color, urine frequency, orthostatic vital signs, and mucous membrane moisture. Chronic medications like diuretics for blood pressure or heart failure alter fluid balance, and kidney function often declines with age, so hydration status can shift quickly during illness or heat exposure.
Pregnancy increases fluid needs because blood volume expands and the body supports a growing baby. Pregnant individuals should aim for consistent pale yellow urine and avoid both dehydration and overhydration. Dark urine or infrequent urination may signal insufficient intake. Persistent clear urine combined with nausea or headache can indicate overhydration and low sodium (hyponatremia). People with kidney disease, heart failure, or diabetes require tailored hydration assessment, often guided by a healthcare team, because standard fluid recommendations may not apply and fluid overload carries serious risks. Always discuss hydration targets with a clinician if you’re managing a chronic condition or taking medications that affect fluid balance.
Tracking Hydration Status Over Time for Better Accuracy
Single snapshots of hydration can mislead because fluid balance shifts hour by hour with meals, activity, temperature, and illness. Tracking trends over days and weeks reveals your personal baseline, helps you catch small changes before they become problems, and builds the pattern recognition skills that make quick daily checks more reliable.
A simple hydration log should capture date and time, urine color on a 1–8 scale, body weight in kilograms, fluid intake in milliliters, estimated urine output, any symptoms like dizziness or dry mouth, and resting heart rate and blood pressure if you’re monitoring closely. For routine daily tracking, one entry each morning is enough. During illness, recovery from surgery, or heavy training blocks, record every four to six hours to catch trends early. In intensive monitoring situations (such as acute illness or post-competition recovery) hourly records help clinicians or coaches make rapid adjustments to fluid and electrolyte intake.
Track these three data points daily for the clearest hydration picture:
- First-morning body weight weigh at the same time each day, after using the bathroom and before eating or drinking; sudden drops of more than 1 percent flag possible dehydration.
- First-morning urine color record the number (1–8) in your log; consistency in the 1–3 range means your hydration strategy is working.
- Total fluid intake over 24 hours log water, coffee, tea, milk, juice, and other drinks in milliliters; aim for roughly 3.7 liters per day for men and 2.7 liters for women from all sources, including food.
Weight stability is one of the best indicators that your daily fluid intake matches your losses. If your weight trends down over several days despite normal eating, increase your fluid intake and reassess. If weight climbs rapidly along with swelling in your hands, feet, or face, you may be retaining too much fluid. Reduce intake and consider a medical evaluation if the pattern continues. Use a notebook, spreadsheet, or hydration tracking app to log your data, and review the trends weekly to spot patterns you’d miss from memory alone.
When to Seek Medical Attention for Hydration Problems

Most hydration issues resolve with increased fluid and electrolyte intake over a few hours to a day. But certain signs indicate a medical emergency or a need for professional evaluation and treatment. Knowing when to stop self-managing and seek help can prevent serious complications like kidney injury, electrolyte imbalance, or cardiovascular collapse.
Severe dehydration stresses the heart and kidneys, and symptoms escalate quickly once fluid loss exceeds 5 percent of body weight. Altered mental status (confusion, disorientation, or difficulty staying awake) signals that dehydration has affected brain function and requires immediate medical attention. Persistent vomiting or diarrhea lasting more than 24 hours, especially if you can’t keep fluids down, depletes both water and electrolytes faster than you can replace them at home. Fainting or near-fainting when standing, a rapid heart rate above 120 beats per minute at rest, or a systolic blood pressure below 90 mmHg all point to critically low blood volume and the need for intravenous fluids.
Watch for these five red flags that require urgent medical evaluation:
- Cola-colored or very dark brown urine may indicate rhabdomyolysis (muscle breakdown) or liver problems; see a provider immediately.
- Urine output below 30 mL per hour for several hours suggests kidney stress and requires assessment.
- Severe dizziness, fainting, or inability to stand without feeling faint signs of dangerously low blood volume.
- Confusion, slurred speech, or altered consciousness indicates dehydration affecting the brain or possible electrolyte imbalance.
- Persistent vomiting, diarrhea, or inability to keep fluids down for more than 24 hours rapid fluid and electrolyte loss that needs medical management.
Overhydration and hyponatremia (low blood sodium) are less common but equally serious. If you’ve been drinking large volumes of plain water for days (especially during endurance events or illness) and develop nausea, headache, confusion, or swelling in your hands and feet, your sodium may be too low. Hyponatremia can cause seizures and brain swelling if untreated, so seek medical help if you suspect it. When in doubt, call your healthcare provider or visit an urgent care clinic for evaluation, lab work, and guidance. Hydration problems caught early are far easier to correct than those that progress to severe dehydration or dangerous electrolyte shifts.
Final Words
Start by checking urine color, thirst, skin turgor, and how often you pee. Those are the fastest signals to act on.
For more accuracy, use validated urine color charts, urine specific gravity or osmolality tests, pre/post exercise weighing, and basic clinical checks for caregivers. Track changes across days.
Treat adjustments as small experiments and bring your notes to a clinician if red flags appear.
This guide on how to check hydration status gives simple steps you can try today, track, tweak, and you’ll feel steadier soon.
FAQ
Q: How do you assess hydration status, how can I check my hydration level at home, and what is the best indicator of hydration status?
A: To assess hydration status at home, check urine color (pale is good, dark suggests dehydration), urination frequency, thirst, skin turgor, body‑weight change, or use urine specific gravity for greater precision.
Q: What are the 12 warning signs of dehydration?
A: The 12 warning signs of dehydration are: thirst, dark urine, infrequent urination, dry mouth, dry skin, sunken eyes, dizziness or lightheadedness, fatigue, headache, muscle cramps, rapid heartbeat, and low urine output.