


What if most of your “train through it” days are actually slowing your gains?
You can stop guessing and use simple data plus body signals to decide if you’re ready to train.
In under five minutes each morning, a few quick checks: HRV, resting heart rate, sleep, soreness, a warm-up test, and your energy give a clear go or no-go.
This post shows a fast, practical routine so your hard days build fitness, not deeper fatigue.
Fast Ways to Tell if You’re Recovered Enough to Train Again

You don’t need a blood panel or a full battery of tests to figure out if you’re ready for another workout. A handful of quick morning checks, things you can knock out in under five minutes, give you enough info to decide whether your body’s bounced back or still needs more time. The trick is using the right signals and combining them into a single go or no-go call before you load the bar or lace up your shoes.
Most athletes waste energy guessing or pushing through sessions when their body is waving red flags. Build a short morning routine around six core indicators that reflect nervous system status, tissue repair, and metabolic readiness instead. These signals work together to show whether another hard session will build fitness or just dig you deeper into fatigue.
Your daily readiness checklist:
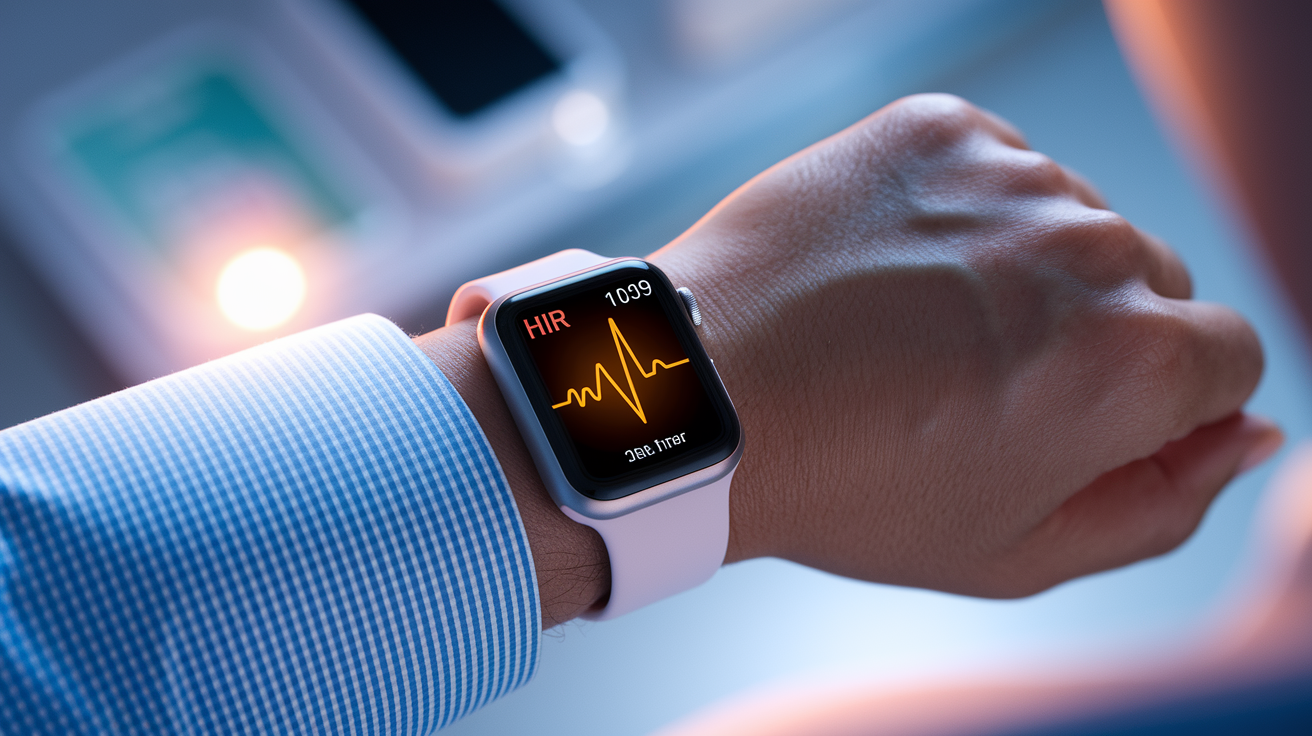
HRV (heart rate variability): A drop of more than 10–20% from your personal baseline usually means your nervous system hasn’t recovered. Track this with a chest strap or wearable for one to five minutes after waking.
Resting heart rate: An increase of five beats per minute or more above your normal waking heart rate signals incomplete recovery or added stress.
Sleep quality: Aim for seven to nine hours with minimal wake-ups. One rough night won’t wreck you, but two or three in a row will.
Soreness level: Rate muscle soreness on a 0–10 scale. Anything above a 6 suggests you need lighter work or rest.
Performance readiness: Can you hit your usual warm-up weights or paces without feeling sluggish? A noticeable drop in bar speed, jump height, or sprint time means you’re not ready.
Mood and energy: Persistent low motivation, irritability, or fatigue that doesn’t lift after your warm-up is a valid signal to back off.
When most of these factors land in the green zone (HRV stable or elevated, resting heart rate normal, sleep decent, soreness mild, performance markers sharp, mood solid) you can proceed with your planned training. If two or more indicators are off, especially if resting heart rate is elevated and HRV is suppressed, swap the hard session for easy aerobic work, technique practice, or a full rest day. Don’t override multiple warning signals hoping willpower will carry you through. Recovery is when adaptation happens. Training on top of incomplete recovery just extends the fatigue without adding fitness.
Understanding and Tracking HRV for Recovery

Heart rate variability measures the time gaps between consecutive heartbeats, and those tiny fluctuations reflect your autonomic nervous system’s balance. When you’re well recovered, your parasympathetic branch (the “rest and digest” side) dominates, and your heart rate speeds up and slows down subtly with each breath. That variation shows up as higher HRV. When you’re stressed, fatigued, or fighting off illness, your sympathetic “fight or flight” system stays more active, flattening those beat to beat changes and dropping your HRV. It’s one of the most sensitive early warning signals you can track without needing lab equipment.
Consistent HRV tracking matters more than any single reading. Your absolute HRV number depends on age, genetics, and training history. Some people run a baseline around 30 milliseconds, others cruise at 100 milliseconds. What counts is your trend relative to your own baseline. Build that baseline by measuring HRV every morning for seven to fourteen days under the same conditions: within one to ten minutes of waking, lying down or seated, before coffee or screens. Use a chest strap or a validated wearable, set a one to five minute measurement window, and log the result. Once you have that baseline, a drop of more than 10% on a single day is worth noticing. A drop of more than 20% sustained across two or three days is a clear sign to dial training back.
To keep HRV readings consistent, take them at the same time each morning, in the same position, and breathe normally. No deep breathing tricks or breath holds unless your app’s protocol specifically calls for it. Lying supine tends to give the most stable readings, but seated works if you stay still. Record the value in a simple spreadsheet, note pad, or tracking app, and watch the seven day rolling average. You’ll start to see patterns. HRV dips after big volume weeks, spikes on rest days, and stays suppressed if you string together too many hard sessions without recovery.
Factors That Temporarily Lower HRV
Even one night of heavy alcohol use can knock your HRV down for twenty four to forty eight hours as your liver works overtime and sleep architecture gets disrupted. Poor sleep (whether from late nights, frequent wake-ups, or low sleep quality) shows up the next morning as reduced HRV because your nervous system never downshifted into full recovery mode. Illness, even a mild cold, suppresses HRV as your immune system ramps up. Dehydration shifts fluid balance and stresses cardiovascular regulation, also lowering HRV. Psychological stress from work deadlines, arguments, or major life events triggers the same sympathetic activation that hard training does, and your HRV will reflect that cumulative load. All of these stressors add up. Your body doesn’t separate “training stress” from “life stress” when calculating recovery capacity.
Using Resting Heart Rate as a Simple Recovery Signal
Your resting heart rate is the number of beats per minute your heart ticks off when you’re fully at rest, and it’s one of the easiest objective metrics to grab each morning. Measure it right after waking, before you stand up or check your phone. Either wear a wearable overnight or place two fingers on your wrist or neck for thirty to sixty seconds and count. An elevated resting heart rate (typically five to ten beats per minute higher than your personal baseline) usually signals that your body is still working to clear metabolic byproducts, repair tissue, or fight off an incoming illness. That elevated rate means your cardiovascular system is running hotter than usual, and adding another hard training session on top just extends that stress.
Establish your baseline the same way you do for HRV. Measure every morning for seven to fourteen days when you’re not sick, not in heavy training, and sleeping reasonably well. Calculate the average. From that point forward, any single day spike of five beats per minute or more is a yellow flag. If your resting heart rate stays elevated for two or three consecutive mornings, treat it as a red flag and reduce training intensity or volume. A sustained increase of seven to ten beats per minute, especially if it lasts a week or more, warrants medical review. You might be on the edge of overtraining syndrome, fighting an infection, or dealing with another health issue that needs attention.
Resting heart rate responds faster than many other metrics, which makes it a practical early warning tool. It’ll climb before you feel overtly fatigued and often drops back to baseline within twenty four to forty eight hours of adequate rest. Pair resting heart rate with HRV for a more complete picture. When both are off (resting heart rate up, HRV down) you have strong evidence that recovery isn’t complete, and you should adjust your session accordingly.
Sleep Quality and Duration as Predictors of Recovery

Sleep is when your body releases growth hormone, consolidates motor learning, clears metabolic waste from the brain, and rebuilds damaged muscle fibers. Aiming for seven to nine hours per night gives most adults the window they need for full hormonal and neurological repair. Athletes in heavy training blocks may need closer to eight to ten hours, especially after high volume or high intensity days. Anything less than six hours consistently will degrade performance, slow strength gains, reduce power output, and increase injury risk.
Duration matters, but quality counts just as much. Fragmented sleep (waking up multiple times, tossing and turning, never sinking into deep or REM stages) leaves you under recovered even if you spent eight hours in bed. Track both total sleep time and subjective sleep quality each morning. Many wearables now break down sleep stages and flag wake events, giving you a clearer picture of whether you actually got restorative rest or just lay horizontal for a while.
Five indicators of restorative sleep:
Sleep continuity: Minimal wake events, ideally zero to two brief awakenings per night.
REM percentage: Roughly 20–25% of total sleep should be REM. Lower percentages can indicate stress or poor recovery.
Deep sleep percentage: About 15–20% of total sleep. Deep sleep is when growth hormone peaks and physical repair happens.
Wake events: Fewer than three significant wake-ups per night.
Subjective grogginess: Waking up feeling alert rather than heavy, foggy, or still exhausted.
Integrate sleep data with your training load by looking at patterns. If you log five nights of less than seven hours and your HRV drops while resting heart rate climbs, you’re stacking sleep debt on top of training stress. That’s when performance starts to slide and injury risk jumps. Before scheduling another heavy session, prioritize one or two nights of solid sleep. If you can’t control total sleep time due to work or life demands, at least reduce training intensity on nights you know will be short. Swap your planned high intensity interval session for thirty to sixty minutes of easy aerobic work or technique drills until sleep normalizes.
Evaluating Muscle Soreness and Soft Tissue Readiness
Muscle soreness (delayed onset muscle soreness or DOMS) peaks twenty four to seventy two hours after a novel or high volume training stimulus. A moderate level of soreness, say a 3 or 4 on a 0–10 scale, is normal and doesn’t necessarily mean you should skip training. It’s a sign your muscles are adapting to new stress. But severe soreness (anything rated 7 or higher) reduces your force output, compromises movement quality, and raises the risk of compensatory injury if you try to push through another intense session.
Track soreness each morning on that 0–10 scale. 0 means no soreness at all, 10 means debilitating pain that limits normal movement. Soreness in the 0–3 range generally clears you for normal training. Soreness in the 4–6 range suggests you reduce volume or intensity by twenty to fifty percent, or substitute your planned hard session with active recovery. Think easy cycling, swimming, or mobility work. Soreness at 7 or above means prioritize rest, light movement, hydration, and nutrition. Don’t load heavy weights or run intervals when your legs feel like concrete. You’ll just extend the recovery timeline and risk turning muscle fatigue into a strain or tendon issue.
Distinguish between muscle soreness and pain that signals injury. Soreness is diffuse, bilateral, improves with movement and warm-up, and fades over a few days. Pain from injury is often sharp, localized, worsens with specific movements, and doesn’t improve or gets worse as you move. If soreness persists beyond seventy two hours without improvement, or if it’s asymmetric and accompanied by swelling or reduced range of motion, treat it as a potential injury and get it evaluated rather than training through it.
Performance Metrics and Readiness Testing
Quick objective tests give you a snapshot of your neuromuscular system’s readiness without requiring a full training session. These tests are simple, take less than five minutes, and reveal whether your central nervous system and musculoskeletal system have recovered enough to produce power and speed.
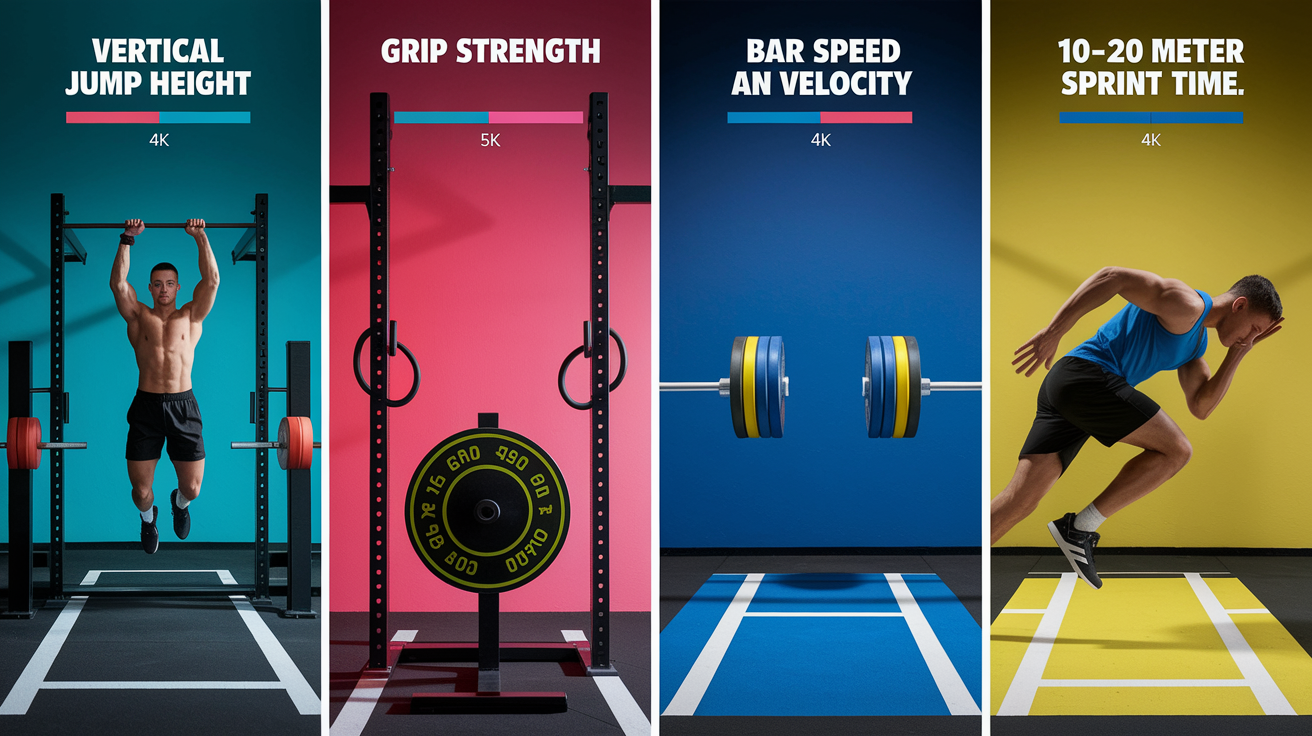
Four practical readiness tests:
Vertical jump: Measure or estimate your standing vertical jump height. A drop of more than 10% from your baseline suggests central nervous system fatigue.
Grip strength: Use a hand dynamometer if you have one. Reduced grip strength often mirrors whole body fatigue.
Bar speed: Load a barbell to 60–70% of your one rep max and perform two to three reps, tracking bar velocity with an app or velocity based training device. A drop of more than 10% indicates incomplete recovery.
Short sprint time: Run a ten to twenty meter sprint and time it. A slower time compared to your baseline signals reduced power output and nervous system readiness.
Run one or two of these tests during your warm-up on training days when your other recovery markers are borderline. If your vertical jump is down 15%, your resting heart rate is elevated, and your HRV is suppressed, you have converging evidence that your body isn’t ready for a high intensity session. In that case, reduce the session’s volume by thirty to fifty percent, drop the intensity by one to two zones, or swap the planned workout for thirty to sixty minutes of steady aerobic work.
Use rolling baselines for these tests the same way you do for HRV and resting heart rate. Measure your vertical jump, grip strength, or sprint time two to three times per week for a few weeks when you’re feeling good, then average those values. From that point forward, compare each test result to your baseline. Small fluctuations (within 5%) are normal day to day noise. Drops beyond 10% are meaningful signals, especially when they cluster with other poor recovery indicators. If performance metrics stay suppressed for more than three to five days despite reduced training, consider taking two to three full rest days or entering a planned deload week before resuming normal intensity.
Interpreting Subjective Readiness and Mood
Your mood, motivation, and energy levels are early indicators of systemic fatigue, often showing up before objective metrics fully reflect the problem. Persistent low motivation to train (where you used to feel eager and now you dread the session) is a valid warning sign. Irritability, brain fog, trouble concentrating, or a flat emotional state that lasts more than a day or two often signals that your nervous system hasn’t recovered from recent training stress or that life stress is piling on top of training load.
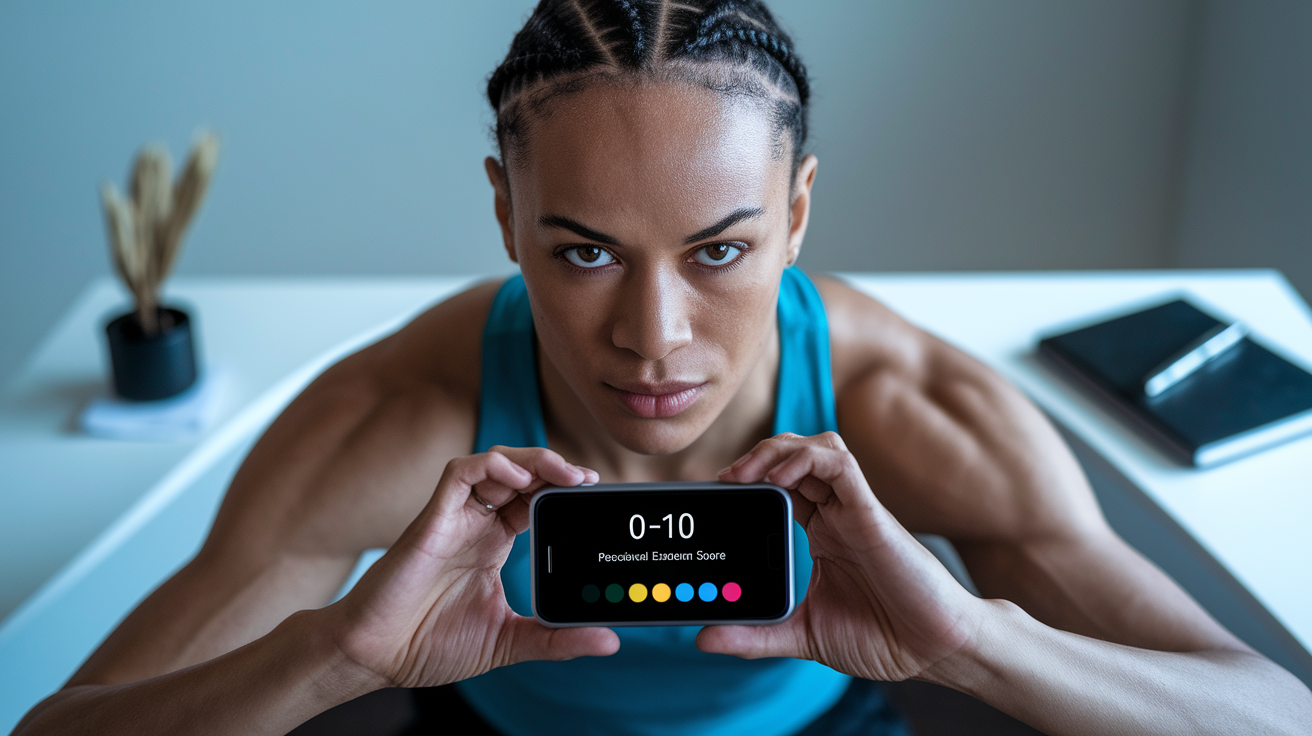
Track your mood and energy each morning on a simple 0–10 scale. 0 means exhausted and miserable, 10 means energized and motivated. Log it alongside HRV, resting heart rate, sleep, and soreness. When your mood score drops by two or more points for two consecutive days, treat it the same way you’d treat an elevated resting heart rate. Reduce training intensity or add an extra rest day. Chronic low mood combined with poor sleep, elevated resting heart rate, and suppressed HRV is a strong signal that you’re heading toward overreaching or overtraining syndrome if you don’t back off.
Perceived exertion during sessions also tells you whether your body is handling the planned load. If a workout that normally feels moderate suddenly feels hard (same pace, same weight, but your rating of perceived exertion jumps from a 6 to an 8) that mismatch indicates incomplete recovery. Note these spikes in your training log and use them to guide your next session. If perceived exertion stays elevated across two or three workouts, reduce volume by twenty to fifty percent or insert an active recovery day before resuming normal training. Integrating subjective scores with objective data creates a fuller picture. One metric might be off on any given day, but when mood, energy, perceived exertion, HRV, and resting heart rate all point the same direction, the signal is clear and you should adjust accordingly.
Tools and Wearables for Tracking Recovery Data

Modern wearables measure HRV, resting heart rate, and sleep architecture automatically, removing most of the manual tracking burden. Chest straps paired with apps deliver the most accurate HRV readings, while wrist worn devices and smart rings offer convenience with slightly less precision. Many of these tools combine your metrics into a single “readiness score,” which simplifies decision making but can also obscure the individual signals if you don’t dig into the details.
Chest straps (like Polar H10 or Garmin HRM-Pro) run about thirty to one hundred dollars and pair with free or low cost HRV apps on your phone. They’re considered the gold standard for heart rate accuracy. Wrist worn fitness watches from brands like Garmin, Apple, Whoop, or Polar cost one hundred fifty to six hundred dollars and track HRV, resting heart rate, sleep stages, and activity load continuously. Smart rings like Oura fall in the two hundred to four hundred dollar range and focus heavily on sleep and recovery metrics. Many of these devices require a monthly subscription (five to thirty dollars) for full analytics and trend reports.
No tool is perfect. Wrist worn devices can miss beats during intense movement, and HRV accuracy varies by sensor quality and algorithm. Smart rings are excellent for sleep and resting metrics but don’t track exercise heart rate well. Chest straps are accurate but require you to remember to wear them each morning. Choose the tool that fits your routine and budget, then commit to using it consistently. Daily data collected over weeks is far more valuable than sporadic high tech measurements.
| Tool Type | Key Metrics | Accuracy Notes |
|---|---|---|
| Chest strap + app | HRV, HR, some sleep tracking | Highest HRV and HR accuracy; requires manual morning use |
| Wrist worn watch | HRV, RHR, sleep stages, activity load | Good overall; HRV slightly less precise than chest strap |
| Smart ring | HRV, RHR, sleep stages, body temp | Excellent sleep tracking; limited exercise HR tracking |
| Smartphone app (camera based) | HRV, RHR | Convenient but less accurate; best for rough trends |
Adjusting Training Based on Recovery Indicators
When most recovery indicators are in the green (HRV stable or elevated, resting heart rate normal, sleep solid, soreness low, performance metrics sharp) proceed with your planned training. High recovery capacity means your body can handle intensity, volume, and the adaptive stress that builds fitness. But when multiple signals turn yellow or red, pushing through the scheduled session just adds fatigue without triggering useful adaptation. The smarter move is to adjust the session or take extra rest so you come back stronger rather than digging deeper into a hole.
Five steps to modify training when recovery indicators are poor:
- Reduce volume: Cut total sets, reps, or workout duration by 30–50%. Keep the movement patterns and intensities but do less total work.
- Adjust intensity: Drop planned high intensity intervals or heavy lifts and replace them with submaximal work. Steady aerobic efforts, technique drills, or lighter loads at moderate tempo.
- Switch modalities: If you planned a hard run but your legs are trashed, swap it for cycling, swimming, or rowing at an easy pace to maintain aerobic stimulus without pounding sore tissue.
- Add rest: Insert a full rest day or an active recovery session (20–40 minutes of easy movement, stretching, or mobility work) instead of the scheduled training.
- Re-evaluate next day: Check your metrics again the following morning. If indicators improve (HRV rebounds, resting heart rate drops, soreness eases) you can resume normal training. If they stay poor, extend the recovery period.
Preventing chronic fatigue patterns requires you to respect early warning signs before they compound. One bad night of sleep or a single elevated resting heart rate reading isn’t a crisis, but three to five consecutive days of poor metrics without adjustment leads to overreaching. At that point, you’ll need a longer recovery period (sometimes a full week or more) to get back to baseline. Catching the trend early and making small adjustments keeps you training consistently rather than forcing multi week breaks to recover from accumulated fatigue.
Final Words
You’ve got quick checks: HRV and resting heart rate, sleep quality, soreness level, short performance tests, and daily mood notes. Together they show if your nervous system and muscles are ready.
Take morning readings and a simple test, combine objective data with how you feel, and pick one small change on low days. Wearables help, but trends beat single values.
If you want to know how to monitor recovery between workouts, try this for a week and treat it like an experiment. You’ll spot clearer patterns and make better training choices.
FAQ
Q: What is the 3-3-3 rule for working out?
A: The 3-3-3 rule for working out is a simple strength template: three sets of three reps, done about three times a week with heavy loads and full rest between sets to build strength efficiently.
Q: What is the 5-3-1 rule in gym?
A: The 5-3-1 rule in the gym is a progressive strength cycle: you rotate weeks of five, three, then one rep for main lifts, using planned percentages of your max to increase load gradually.
Q: What is the 130 hour rule?
A: The 130 hour rule is unclear without context; it commonly refers to a limit or guideline (for work, training, or certification) totaling 130 hours over a set period—check the specific field for the exact meaning.
Q: How to measure recovery after exercise?
A: Measuring recovery after exercise involves tracking morning HRV and resting heart rate, sleep quality, muscle soreness, short performance tests, and mood and energy, then watching trends over days to decide readiness.