


What if most stress tracking is guessing and misses the real triggers?
Tracking your stress works best when you pair what you notice with simple body signals.
Short, repeatable checks work.
Think a daily stress journal, two quick HRV checks, meaning heart rate variability, timed saliva cortisol samples, and random app prompts.
They show when stress spikes and what likely caused them.
This isn’t about perfect data or fancy gear.
It’s about a small system that turns vague worry into clear patterns you can test and fix.
Core Stress Tracking Methods for Immediate Use
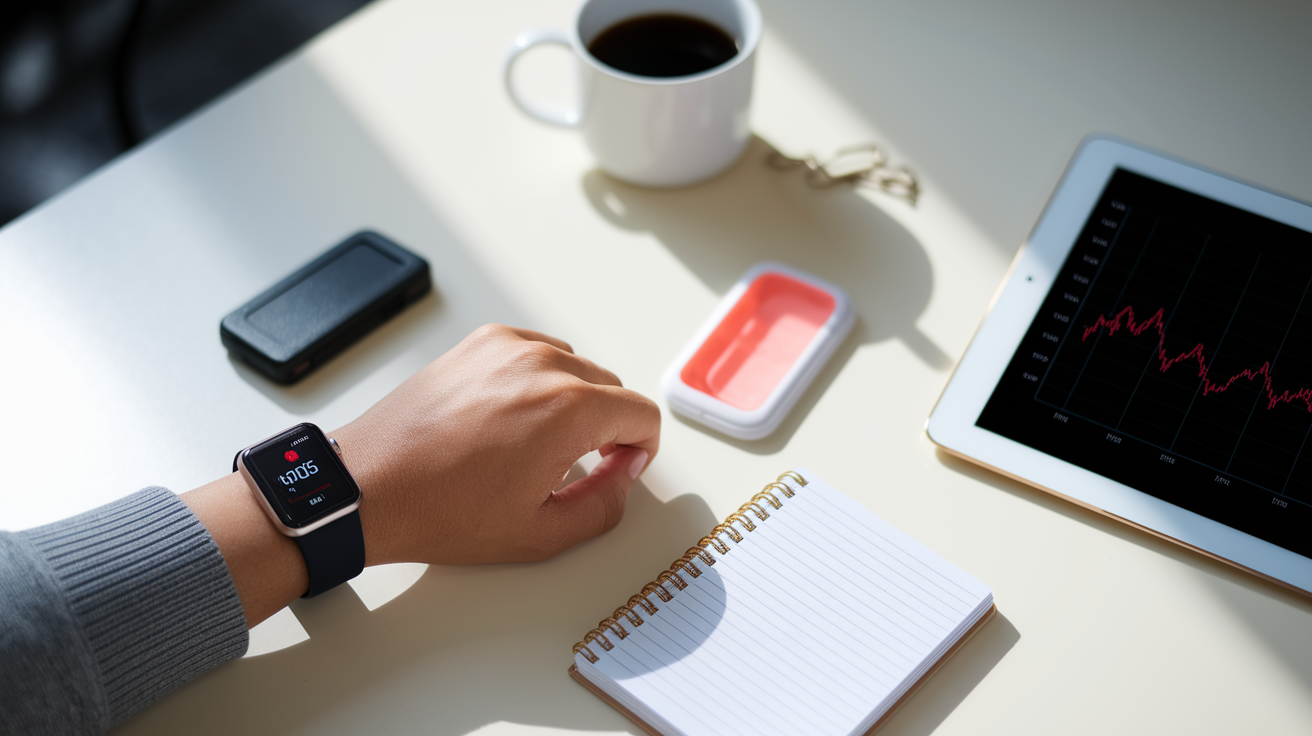
Stress response tracking works best when you capture both what you notice in your head and what your body’s actually doing. The smartest approach mixes how you feel with what the numbers say—heart rate, breathing patterns, cortisol levels. This combo catches patterns you’d miss if you’re just going off memory. Your daily toolkit can be pretty simple: a stress journal, a 0 to 10 rating, two quick heart rate variability checks per day, and a weekly survey. These work because they build a data trail that shows you what sets you off, when it happens, and how bad it gets. You’re turning vague worry into something you can actually test.
Here’s what people actually use to track stress day to day:
- Daily stress journal: jot down date, time, what was happening, stress rating 0 to 10, physical stuff you felt (chest tightness, headache, fatigue), how you tried to cope, and how long it lasted.
- Self report scales: fill out the Perceived Stress Scale or Daily Stress Inventory once a week to put a number on subjective load.
- Heart rate and HRV monitoring: grab your resting HR and HRV right when you wake up and before bed using a wearable or chest strap.
- Mobile app prompts: use apps that ping you at random times to log stress levels and context right then, not hours later when memory gets fuzzy.
- Biofeedback sensors: measure skin conductance, muscle tension, or brainwave activity during high stress windows.
- Respiratory rate tracking: keep tabs on breathing rate all day via a chest device or camera app.
- Saliva cortisol kits: collect samples around 30 minutes after waking to catch the cortisol awakening response.
- Passive behavioral data: log sleep duration, step count, screen time, caffeine intake as background markers of stress impact.
Mixing subjective and objective tracking makes things more accurate because each method has blind spots. Journals catch the nuance and story but lean on memory and honesty. Sensors pick up what your body shows before you even feel stressed, but they can get fooled by illness, caffeine, or bad sensor placement. When your stress diary spikes at the same time your HRV drops and your resting heart rate jumps, you’ve got real converging evidence. That’s a clear target for intervention.
Understanding Physiological Signals Behind Stress Tracking
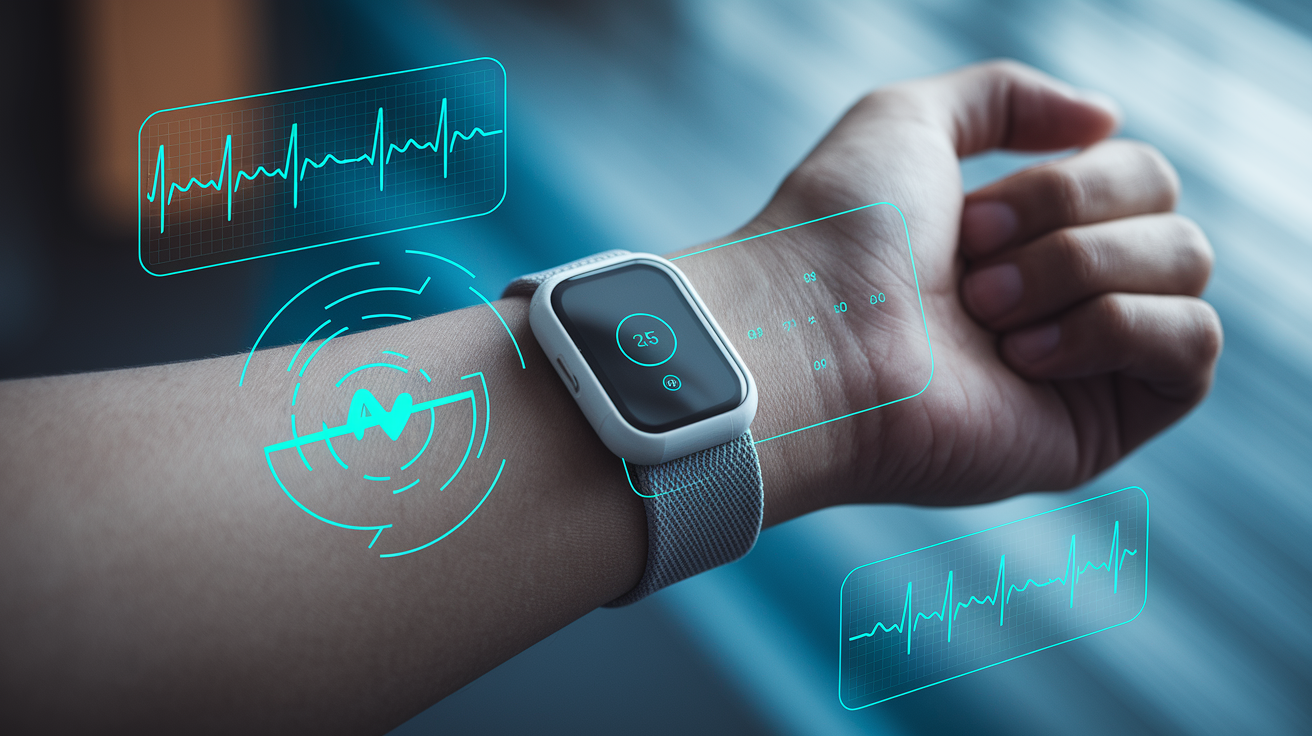
Your body broadcasts stress before your brain fully clocks it. Heart rate climbs, breathing speeds up, muscles tighten, sweat glands fire up—all within seconds of sensing a threat or overload. Acute stress looks like a quick spike: heart rate jumps 10 to 20 beats above baseline, breathing climbs from 12 to 16 breaths per minute up to 18 to 24, and heart rate variability tanks for minutes or hours. These changes flip back pretty fast once the stressor’s gone, which is why one reading can mislead you. Chronic stress rewires your baseline. Resting heart rate stays high, HRV stays low, sleep fragments, and your body’s ability to bounce back between stressors weakens over weeks.
Biofeedback devices quantify these shifts by measuring skin conductance (sweat gland activity), muscle tension via EMG, and brainwave patterns using EEG. Skin conductance spikes when your sympathetic nervous system kicks in, even if you report feeling calm. EMG sensors catch tiny muscle contractions in your jaw, neck, and shoulders that pile up during work stress or anxiety. EEG headbands show whether your brain’s in active problem solving mode (beta waves), relaxed focus (alpha), or deep calm (theta). Because these signals run below conscious control, they often flag stress earlier than self report can.
The real win in tracking physiology is early detection and objective proof. When you notice fatigue or irritability days after stress starts, physiological markers have already moved. A sustained HRV drop of 10 to 20 percent below your personal baseline for three or more days in a row often shows up a week before you feel burnout. Respiratory rate and heart rate changes can pop up within minutes of a conflict or deadline, giving you instant feedback to test breathing drills, short walks, or mental reframing and then measure whether those tactics actually work.
HRV Focused Stress Response Tracking Explained
Heart rate variability reflects the tug of war between your sympathetic (fight or flight) and parasympathetic (rest and digest) nervous systems. Higher HRV usually signals better autonomic flexibility and resilience, meaning your body can ramp up for action and then slide back to calm efficiently. Lower HRV points to sympathetic dominance and weaker recovery capacity, a pattern you see with chronic stress, overtraining, poor sleep, and cardiovascular disease. Tracking HRV over 14 to 30 days sets your personal baseline, which varies by age, fitness, genetics, and health status. What matters most is change from your own norm, not how you stack up against population averages. Sleep quality, illness, caffeine, alcohol, meds, hydration, even meal timing all mess with HRV, so consistent measurement conditions (same time, same position, fasted or fed) cut the noise and show true stress trends.
Time Domain Metrics
Time domain HRV metrics calculate the variation in milliseconds between successive heartbeats. The most common measure is RMSSD (root mean square of successive differences), which captures beat to beat changes and reflects parasympathetic activity. A five minute resting recording is the gold standard, but 60 to 180 second ultra short samples work pretty well for spot checks. RMSSD values usually range from 20 to 100 milliseconds in healthy adults. Values consistently below your baseline by 10 milliseconds or more for several days often mean rising stress or incomplete recovery. Another common metric, SDNN (standard deviation of all beat intervals), reflects overall autonomic balance but needs longer recordings—at least 24 hours—to be reliable, making it less practical for daily tracking.
Frequency Domain Metrics
Frequency domain HRV breaks the signal into power bands: high frequency (HF, 0.15 to 0.4 Hz) driven mostly by breathing and parasympathetic tone, and low frequency (LF, 0.04 to 0.15 Hz) influenced by both sympathetic and parasympathetic activity. The LF/HF ratio gets cited a lot as a stress index, with higher ratios suggesting sympathetic dominance. But the ratio’s controversial because LF isn’t a pure sympathetic marker, and normal ranges bounce all over the place across individuals and contexts. For practical tracking, watch how your personal HF power changes over time. Sustained drops in HF alongside low RMSSD confirm reduced parasympathetic activity and signal you need recovery moves like longer sleep, meditation, or lighter training.
Nonlinear Metrics
Nonlinear HRV analysis uses chaos theory and entropy measures to capture how complex and unpredictable your heart rhythm patterns are. Metrics like sample entropy and detrended fluctuation analysis quantify how irregular your heartbeat intervals get. Weirdly, healthy hearts show more variability and complexity, while stressed or diseased hearts become more regular and predictable. These methods are less common in consumer wearables because they need more computing power and longer, cleaner data, but research grade devices and specialized software use them to spot subtle autonomic dysfunction before traditional time or frequency measures flag problems.
A practical rule for HRV based stress detection: if your morning RMSSD drops 10 to 20 percent below your 7 day rolling average and stays down for three or more days straight, treat it as a yellow flag. Cross check with how tired you feel, how you slept, and your resting heart rate. If all three line up, ease back on physical and mental load, prioritize sleep, and retest daily. Most people see HRV bounce back within 3 to 7 days of focused rest, confirming the dip was stress related instead of the start of illness or overtraining syndrome.
Techniques for Tracking Cortisol and Other Biochemical Stress Markers

Cortisol is your body’s main stress hormone, released by the adrenal glands when you sense threat, work out hard, or follow your circadian rhythm. Measuring cortisol directly gives you biochemical proof of stress that sensors can only guess at. The easiest method is at home saliva collection using small swabs or passive drool tubes, which grab free (bioavailable) cortisol without the stress of a needle. Timing matters. Cortisol peaks 30 to 45 minutes after waking (the cortisol awakening response, or CAR), then drops throughout the day, bottoming out around midnight. A single sample is a snapshot. Multiple samples across the day show the cortisol curve and whether the normal rhythm is flattened or jacked up—both patterns link to chronic stress, burnout, and mood disorders.
Hair cortisol analysis gives you a long term stress biomarker. A 3 centimeter chunk of hair closest to your scalp represents roughly three months of integrated cortisol exposure, smoothing out daily swings and showing sustained highs or lows. Hair samples get collected by cutting a small bundle from the back of your head, sealed up, and sent to a lab for extraction and immunoassay. This method works for research and clinical assessment of chronic stress, trauma, or steroid treatment, but it costs more (typically $100 to $200 per sample) and tells you nothing about acute day to day changes. Blood and urine cortisol tests exist too, but they’re more invasive, need lab visits or timed collection, and only capture brief windows—making them less practical for routine self tracking.
Key sampling approaches and timing rules for cortisol tracking:
- Cortisol awakening response (CAR): collect saliva the instant you wake up, then again at plus 30 and plus 60 minutes. Compare peaks across days to spot blunted or exaggerated stress responses.
- Diurnal curve sampling: take 4 to 5 saliva samples spaced through one day (waking, mid morning, afternoon, evening, bedtime) to map the daily rhythm. Flattened curves suggest dysregulation.
- Pre and post stressor sampling: collect baseline saliva before a known stressor (exam, presentation, workout) and 20 to 30 minutes after to measure acute reactivity and recovery speed.
- Hair cortisol for chronic stress: cut a 3 cm segment every 3 months to track long term trends. Useful for checking subjective burnout or measuring intervention effects over time.
- Control for confounders: skip eating, drinking (except water), smoking, or brushing teeth 30 minutes before saliva collection. Note sleep quality, caffeine, medications, menstrual phase. All of these affect cortisol levels.
Wearable & Contactless Devices for Stress Response Monitoring
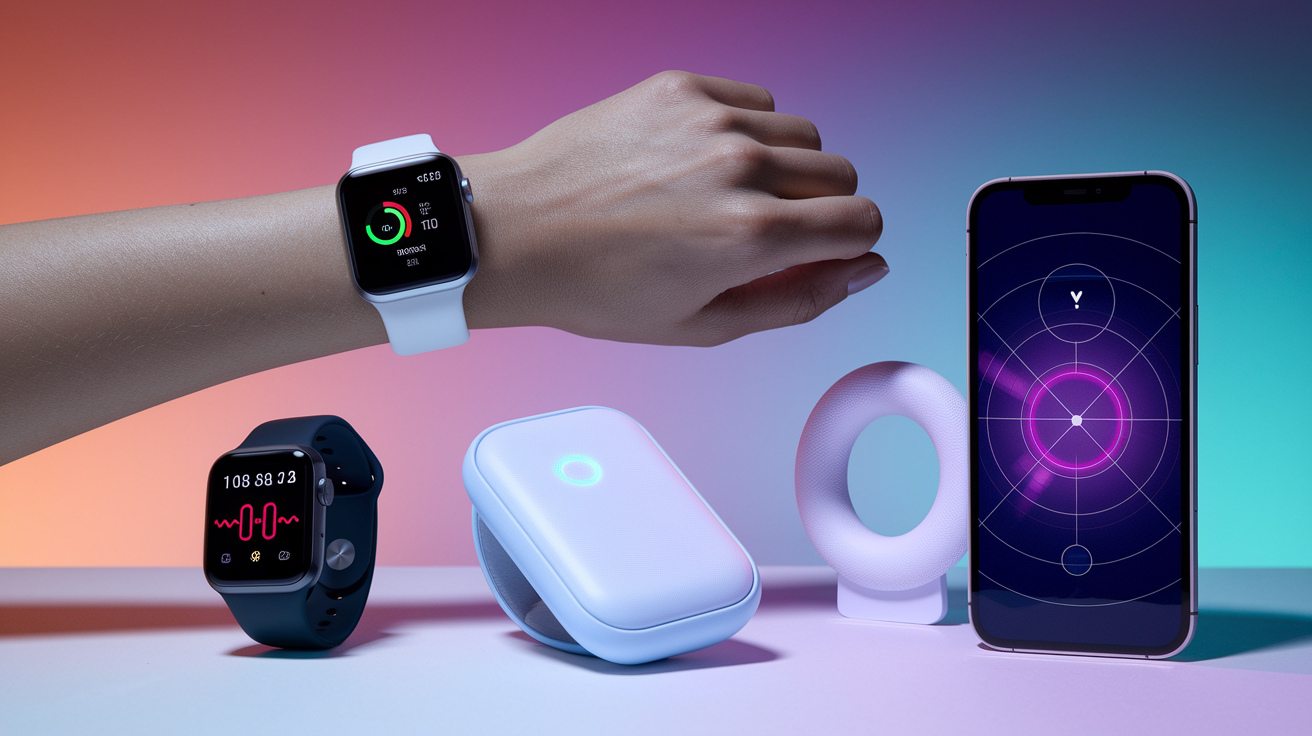
Wearable biosensors have dragged lab grade physiological tracking into everyday life, capturing heart rate, heart rate variability, respiratory rate, and estimated blood pressure continuously or on demand. Most consumer wearables use optical photoplethysmography (PPG)—a green or infrared LED shines through skin, spotting blood volume changes with each heartbeat. Smartwatches and fitness bands run roughly $50 to $400 and offer convenience, all day wear, and app integration, but wrist based PPG struggles with motion, dark skin tones, and tattoos. Chest strap heart rate monitors, used by athletes and clinical devices, deliver cleaner signals closer to an electrocardiogram because they measure electrical depolarization directly. These devices range from $50 for basic models to $300 plus for research grade units. Dedicated biofeedback devices—wrist or finger sensors that track skin conductance, muscle tension, and temperature—add stress context but cost $100 to $1,500 and often need desktop software or clinical help.
Contactless remote photoplethysmography (rPPG) is an emerging technique that pulls heart rate, blood pressure, respiratory rate, HRV, and blood oxygen saturation (SpO2) from video of a person’s face using any standard camera. Algorithms spot tiny color changes in facial skin caused by blood flow, turning pixel intensity swings into a pulse waveform. This kills the need for wearables, making it perfect for telehealth visits, remote patient monitoring, clinical trials, hospital at home programs, and virtual nursing. Accuracy depends on lighting, camera quality, motion, and skin tone. Vendors push validation studies and regulatory compliance (security, HIPAA), and many offer 24/7 tech support for deployment in health systems, payers, and senior care settings.
| Device Type | Strengths | Limitations |
|---|---|---|
| Smartwatches & fitness bands | Continuous passive HR/HRV data, convenient, broad app ecosystems, sleep tracking, roughly $50 to $400 | Wrist motion messes up HRV accuracy, algorithm transparency varies, battery life 1 to 7 days |
| Chest straps & ECG patches | High fidelity R R intervals, medical grade HRV, minimal motion noise, roughly $50 to $300 | Less comfy for all day wear, requires pairing with phone or watch, limited battery in patches |
| Biofeedback devices (EDA, EMG, temp) | Direct sympathetic markers (skin conductance, muscle tension), real time feedback, roughly $100 to $1,500 | Discrete form factors rare, requires user engagement, learning curve, often desktop software only |
| Contactless rPPG (camera based) | No wearable needed, easy deployment for telehealth/clinics, 5 vitals (HR, BP, RR, HRV, SpO2), scalable | Environmental sensitivity (lighting, motion), accuracy validation needed per population, privacy considerations |
Smartphone App and EMA Based Stress Tracking Approaches
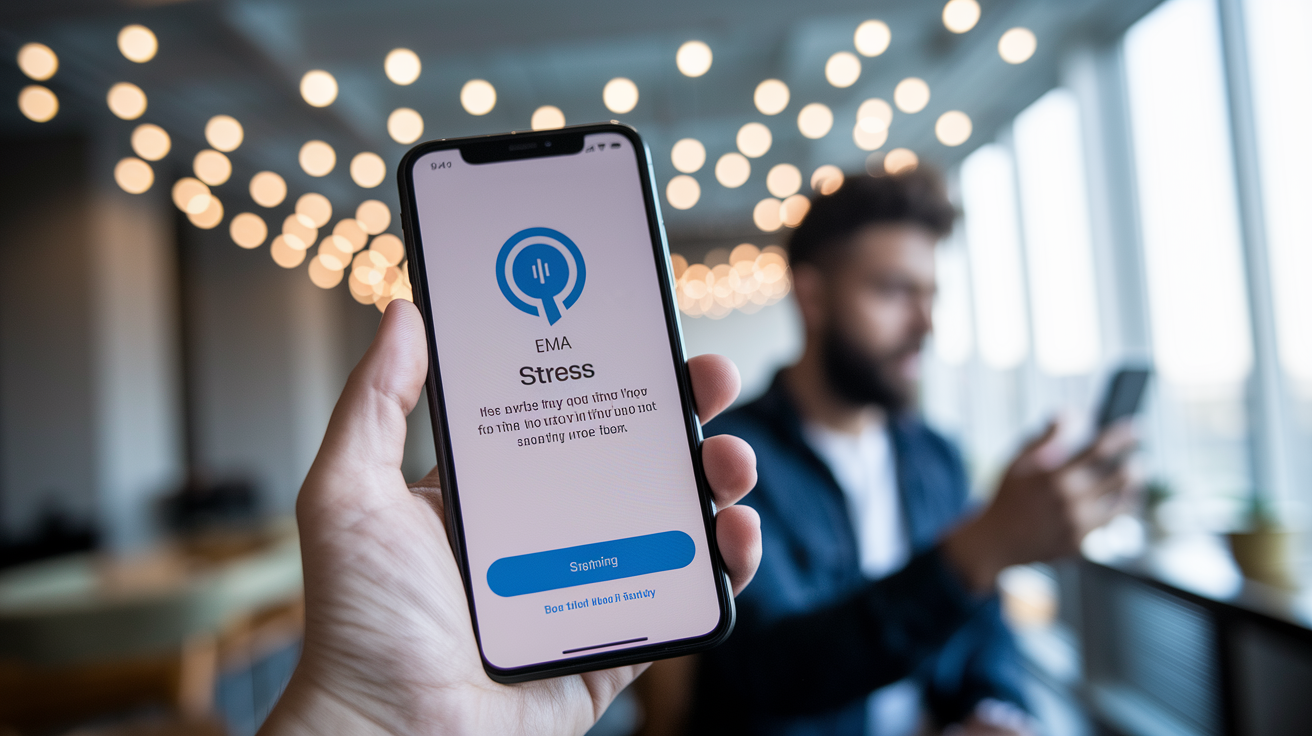
Smartphone apps turn your phone into a stress tracking hub by mixing manual entries, sensor data, and real time prompts. Ecological momentary assessment (EMA) is the gold standard for cutting recall bias. The app pings you at random or scheduled times throughout the day, asking “How stressed are you right now?” along with quick context questions. These in the moment snapshots capture stress as it happens, not as you remember it hours later. Apps also pull in HR and HRV from paired wearables, step counts, screen time, and GPS to build a layered picture of stress triggers and recovery patterns. Many offer trend dashboards, weekly summaries, and personalized insights, with pricing from free ad supported versions to $5 to $10 per month for premium analytics and export features.
The journaling template built into most stress apps mirrors the structure used in clinical research: date and time stamp every entry, note the location and activity (work meeting, commute, gym, home), rate stress intensity on a 0 to 10 scale, list physical symptoms (tight chest, headache, shallow breathing, stomach knot), describe the coping strategy you used (deep breathing, walk, called a friend, ate comfort food), estimate duration, and add free text notes for anything unusual. Consistent field structure lets the app spot patterns. For example, “Your stress spikes above 7 every Tuesday afternoon between 2 and 4 p.m., usually at work, often with a headache, and walking cuts it in half within 30 minutes.” That specificity turns vague stress into an actionable target.
Six examples of EMA prompts that capture real time stress context:
- “Right now, how stressed are you? (0 equals completely calm, 10 equals overwhelming)” plus “What are you doing?” (dropdown: working, commuting, eating, exercising, relaxing, socializing, other).
- “In the last hour, did anything bother or worry you?” (Yes/No) plus If yes: “Briefly describe it in one sentence.”
- “Rate your current physical tension” (0 to 10) plus “Where do you feel it?” (head, neck, shoulders, chest, stomach, back, legs).
- “How well are you handling stress right now?” (Very poorly / Poorly / Okay / Well / Very well).
- “What did you just do to manage stress, if anything?” (Deep breathing, took a break, talked to someone, distraction, nothing, other).
- “How much control do you feel over the situation causing stress?” (None / A little / Some / A lot / Complete).
Data Processing Techniques for High Quality Stress Tracking
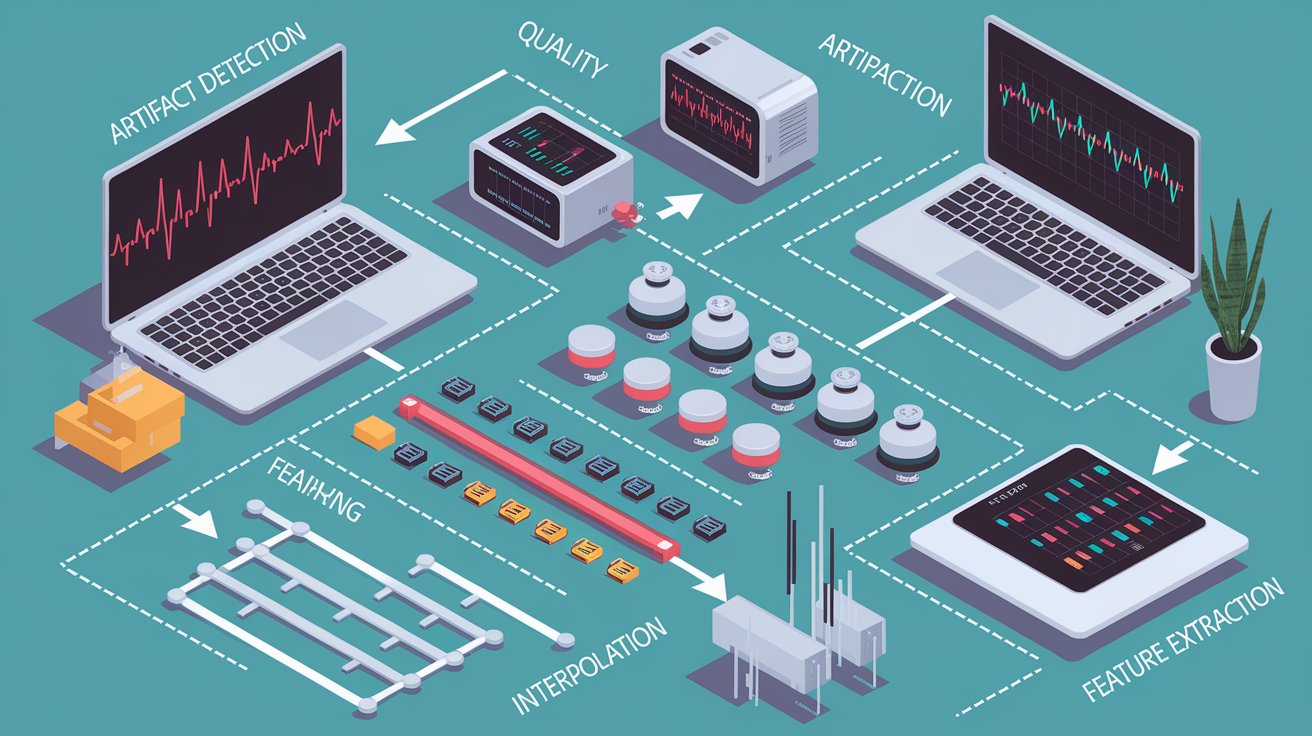
Raw physiological signals from wearables and biofeedback devices come loaded with noise: motion artifacts from walking or typing, electrical interference from nearby gadgets, posture shifts that change sensor contact, and environmental stuff like temperature and lighting. Data preprocessing cleans these signals to isolate true physiological variation from measurement error. For heart rate variability, that means yanking out ectopic beats (premature or skipped heartbeats), fixing sensor dropouts, and filtering intervals wrecked by motion. Best practice calls for morning HRV measurement under consistent conditions—lying flat for five minutes after waking, before caffeine, after a bathroom visit—to minimize confounders and lock in a stable baseline. Blood pressure and respiratory rate face similar challenges. Wrist based BP estimates are shakier than cuff readings, and RR pulled from chest motion sensors can get thrown off by talking, laughing, or movement.
Signal quality indices flag dodgy data segments in real time. Wearables calculate metrics like the percentage of valid R R intervals, signal to noise ratio, and contact quality (how well the sensor sits on skin). If quality drops below a threshold—often 80 to 90 percent valid data—that recording gets marked suspect and tossed from trend analysis. Apps may nudge you to re measure or adjust device placement. For research and clinical use, preprocessing pipelines apply band pass filters to strip high frequency noise and low frequency drift, interpolate missing beats, and detrend signals to isolate the physiological part. These steps are mostly invisible to consumer device users but critical for accurate HRV, BP, and RR numbers.
Reducing motion artifacts and improving data quality follows a four step workflow:
- Wear sensors correctly: chest straps should sit snug below the pecs, wetted with water or electrode gel. Wrist devices should be one finger width above the wrist bone, snug but not tight. Finger sensors need still hands.
- Standardize measurement timing and posture: collect HRV at the same time daily (morning upon waking is best), in the same position (lying flat or seated), after five minutes of quiet rest. Skip measurements within 30 minutes of caffeine, exercise, or stressful events.
- Automated artifact detection: turn on any built in quality checks or “invalid reading” warnings. Review data summaries and trash sessions flagged as low quality. Use apps that show signal quality scores or confidence intervals.
- Manual review and logging: cross check automated readings against how you feel. If HRV looks really high or low on a day you felt normal, suspect artifact. Log confounders (poor sleep, illness, medication changes, alcohol) that explain outliers and help you decide whether to exclude or add context to that data point.
Machine Learning Techniques Used in Stress Detection Models
Machine learning models stitch together heart rate, heart rate variability, respiratory rate, blood pressure, skin conductance, movement patterns, and context data (time of day, location, calendar events) to classify stress states more accurately than any single metric can. Feature engineering transforms raw signals into predictive variables: mean HR, RMSSD, LF/HF ratio, respiratory rate standard deviation, skin conductance peak frequency, step count, screen time, and lagged values from previous hours. Supervised models need labeled training data—thousands of records tagged “stressed” or “not stressed,” often collected in lab experiments or field studies with self report ground truth. Algorithms range from logistic regression and decision trees to random forests, support vector machines, and deep neural networks. Performance gets measured by accuracy (overall correct guesses), sensitivity (true positive rate—nailing stressed moments), and specificity (true negative rate—nailing calm periods). Validation on held out test sets and real world deployment makes sure the model works beyond the training crowd.
Feature Engineering
Feature engineering pulls hidden structure from time series data. Beyond simple averages, features include rolling stats (7 day mean HRV, 30 day standard deviation of resting HR), rate of change (how fast HRV tanks hour to hour), circadian alignment (deviation from expected daily curve), cross metric interactions (HRV divided by resting HR), and event markers (presence of calendar deadline, time since last meal, how close to bedtime). Time lagged features capture momentum—yesterday’s low HRV predicts today’s stress risk. Frequency domain features (LF, HF power) and nonlinear metrics (sample entropy, fractal dimension) add depth. Good feature sets balance richness and clarity. Twenty to 50 well chosen features often beat hundreds of noisy ones.
Supervised Models
Supervised stress classifiers learn from labeled examples. Logistic regression offers transparency and speed, perfect for real time mobile apps. Random forests and gradient boosting machines handle nonlinear relationships and feature interactions, hitting 75 to 85 percent accuracy in published studies. Deep learning models (recurrent neural networks, convolutional networks on spectrogram representations) shine when training data tops tens of thousands of samples, but they need more compute and are tougher to interpret. Training protocols split data 70/30 or use k fold cross validation to dodge overfitting. Class imbalance—way more “not stressed” than “stressed” moments—gets fixed with weighted loss functions or synthetic oversampling. Deployed models retrain periodically on new user data to adapt to individual baselines and drift over time.
Unsupervised Models
Unsupervised methods discover stress patterns without pre labeled data. Clustering algorithms (k means, hierarchical, DBSCAN) group similar physiological states, often revealing “high arousal,” “moderate arousal,” and “rest” clusters that line up with subjective stress reports. Principal component analysis and autoencoders reduce dimensionality, spotlighting the main axes of variation—typically sympathetic vs. parasympathetic tone. Anomaly detection flags weird combinations of metrics (for example, high HR with high HRV, suggesting measurement error or rare physiological state). These techniques work great for exploratory analysis and for people who don’t reliably self report stress, letting the system infer stress episodes from deviation patterns alone.
| Model Type | Data Required | Typical Use Case |
|---|---|---|
| Supervised classification (logistic, random forest, neural net) | Labeled stress/no stress samples (hundreds to thousands), multi metric time series | Real time binary stress alerts, personalized stress score, intervention triggers |
| Unsupervised clustering (k means, hierarchical) | Unlabeled physiological time series, enough samples to define clusters (roughly 500 plus) | Exploratory pattern discovery, segmenting users by stress profile, anomaly baseline |
| Anomaly detection (isolation forest, autoencoder) | Baseline “normal” data (weeks to months), continuous monitoring stream | Flagging unusual stress spikes, early warning for burnout, quality control for sensors |
Personalized Baselines and Longitudinal Stress Trend Analysis
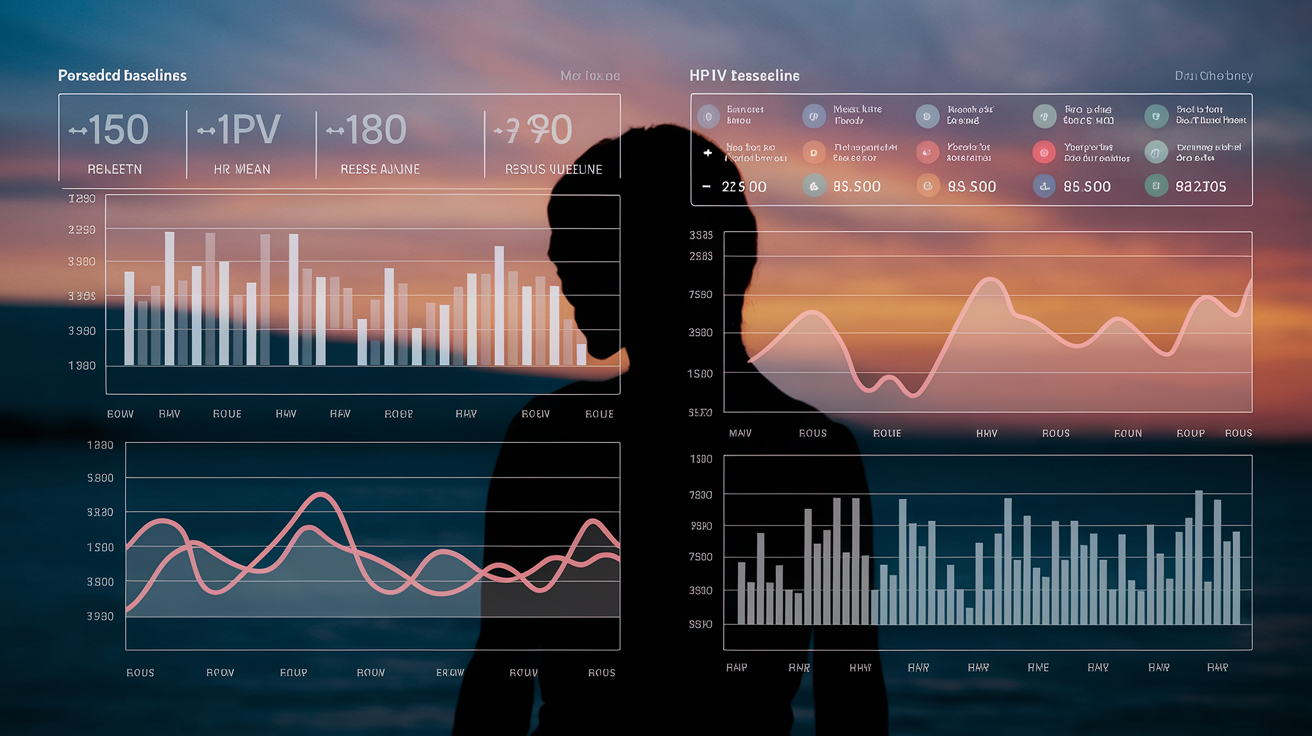
Population average stress metrics are almost useless for individual tracking because heart rate variability, resting heart rate, and cortisol levels swing wildly by age, sex, fitness, genetics, and health history. A 25 year old endurance athlete’s resting HR might sit at 45 bpm with RMSSD above 80 ms, while a desk bound 55 year old’s resting HR might be 75 bpm with RMSSD around 30 ms—both totally normal for their situation. Personalized baselines fix this by measuring your own typical values over 7 to 14 straight days under low stress conditions (no major deadlines, illness, travel, or life chaos). The baseline becomes your reference point. Deviations of 10 to 20 percent in HRV, 5 to 10 bpm in resting HR, or sustained changes in respiratory rate or sleep efficiency for three or more days flag rising stress or weak recovery. Monthly trend reviews show whether those deviations bunch around specific triggers (work projects, relationship drama, seasonal patterns), whether recovery moves restore baseline within a week, or whether chronic drift means you need clinical help or lifestyle redesign.
Longitudinal analysis uses rolling windows—7 day, 14 day, 30 day averages—to smooth daily noise and spotlight persistent shifts. A single bad night drops HRV. A week of bad nights sets a trend. Plotting these windows over months or years reveals seasonal cycles (HRV often dips in winter, climbs in spring), training periodization effects in athletes (HRV drops during high load phases, rebounds in recovery weeks), and the impact of major life changes (job loss, move, illness, new baby). Software tools and apps automate this. Dashboards display current value vs. 7 day mean vs. 30 day mean, color code zones (green equals within baseline, yellow equals 10 to 20 percent deviation, red equals more than 20 percent deviation or 3 plus days yellow), and tag events you logged (traveled, sick, big presentation). The feedback loop—track, spot deviation, intervene, reassess—teaches you which habits move your metrics and builds stress resilience through data driven experimentation.
Five steps for building and using a personal stress baseline:
- Collect at least 14 consecutive days of daily HRV, resting HR, subjective stress score (0 to 10), and sleep duration under stable, low stress conditions. Skip starting during illness, travel, or major life disruption.
- Calculate mean and standard deviation for each metric. Define “normal range” as mean plus or minus 1 standard deviation (roughly 68 percent of your data will land here under stable conditions).
- Set alert thresholds at 10 percent below baseline HRV mean or 5 bpm above baseline resting HR mean, sustained for 3 plus days. Set up app notifications or manual review rules.
- Log context daily: sleep quality (1 to 5 scale), caffeine intake (cups), alcohol (drinks), exercise (type/duration), major stressors (yes/no plus brief note). This background info explains normal swings vs. true stress signals.
- Review and recalibrate monthly: compare current 30 day rolling average to the original baseline. If you’ve made lifestyle changes (new exercise routine, meditation practice, job change), set a new baseline by repeating the 14 day protocol and updating thresholds.
Stress Monitoring in Specific Domains (Workplaces, Athletes, Chronic Conditions)
Workplace stress monitoring uses wearable HRV, desk time tracking, and EMA prompts to spot when workload exceeds recovery capacity. Corporate wellness programs deploy apps that ping employees twice daily—mid morning and mid afternoon—asking about stress level, workload, and breaks taken. Aggregated anonymized data show team level patterns. Marketing spikes every Monday, finance peaks at month end, customer support stays elevated all week. Individuals get personalized nudges—”Your HRV has been low for four days. Consider a 10 minute walk at lunch” or “You’ve logged high stress six afternoons straight. Schedule a meeting free block tomorrow.” Research links sustained low HRV at work to absenteeism, turnover, and burnout, making proactive tracking a retention and productivity tool. Privacy is huge here. Opt in participation, no individual level reporting to managers, encrypted data storage, and clear policies on how aggregate insights get used.
Athletes treat stress tracking as a performance and injury prevention tool. Training load—volume, intensity, frequency—stresses the body. Adaptation happens during recovery. When training stress outpaces recovery, HRV drops, resting HR climbs, subjective fatigue spikes, and injury risk jumps. Elite endurance athletes measure HRV every morning, tweaking that day’s workout intensity based on the reading. HRV within baseline means go as planned, 10 to 15 percent drop suggests dial back intensity but keep volume, 20 percent plus drop or three straight low days triggers a rest day or active recovery session. Coaches fold HRV data into training logs, sleep scores, and subjective wellness questionnaires (muscle soreness, mood, motivation) to periodize load and taper before competition. The same logic works for recreational athletes. A weekend warrior tracking HRV can dodge overtraining by catching when two hard gym sessions plus a brutal work week have drained reserves, prompting an extra rest day instead of pushing through and risking illness or injury.
Stress monitoring in chronic disease management turns tracking into a clinical collaboration tool. Patients with conditions like hypertension, diabetes, chronic pain, or autoimmune disorders live in bidirectional stress disease loops: stress worsens symptoms, symptoms crank up stress. Daily HRV, BP, pain scores, and medication adherence logs feed into shared dashboards reviewed by clinicians during telehealth visits. Patterns pop up—”Your BP spikes line up with low HRV and high subjective stress on Tuesdays and Thursdays. What’s different those days?”—prompting targeted behavioral tweaks (schedule flexibility, mindfulness training, medication timing adjustments). Remote monitoring lets clinicians catch early warning signs (HRV trending down, BP creeping up) and step in before an acute event (hypertensive crisis, flare, hospitalization). Patients gain control and insight, shifting from passive care recipients to active managers of their condition, backed by data that makes the invisible impacts of stress visible and actionable.
Privacy, Security, and Ethical Considerations in Stress Tracking
Stress data ranks among the most sensitive personal info you can generate. It reveals mental health struggles, workplace tension, relationship conflict, and when you’re vulnerable. Apps and wearable platforms vary wildly in how they store, encrypt, share, and monetize this data. Free consumer apps may sell anonymized data to advertisers or researchers. Enterprise wellness platforms may share aggregated reports with employers. Health system integrations must follow HIPAA in the U.S. or GDPR in Europe. Before committing to a platform, dig into the privacy policy for specifics. Is data encrypted in transit and at rest? Where are servers located? Can you export and delete your data? Who has access—third party analytics, insurance partners, app developers? Go for apps with clear data retention limits, end to end encryption, and transparent consent processes that let you control sharing feature by feature.
Ethical considerations heat up when tracking is passive or employer sponsored. Passive monitoring—sensors that grab data without you lifting a finger—raises consent questions. Do you know what’s being recorded and when? Can you pause or kill tracking? Is there mission creep, where a wellness feature morphs into a surveillance tool? Employers using workplace stress tracking need ground rules: voluntary participation, no individual level reporting to managers, anonymized aggregation only, explicit purpose (wellness support, not performance review), and the right to opt out without penalty. Academic and clinical research using stress tracking data requires informed consent, institutional review board approval, and solid anonymization to protect participant identity. Even well meaning tracking can backfire if it spikes anxiety (“Why is my HRV low today?”), creates pressure to perform (“I must stay in the green zone”), or shifts blame for systemic stressors (toxic workplace, unsafe neighborhood) onto individual coping.
Four recommendations for safe and ethical stress tracking use:
- Read the privacy policy and terms of service before hooking up a device or app. Confirm data encryption, retention limits, and your rights to export/delete data. Dodge platforms that claim ownership of your health data.
- Limit third party integrations: only link stress tracking apps to services you trust. Review and yank permissions periodically. Be skeptical of free apps asking for broad access to contacts, location, or other apps.
- If tracking is workplace sponsored, verify anonymity and opt in rules: push for aggregate only reporting, no individual identifiers shared with employers, voluntary participation, and clear separation between wellness programs and performance reviews.
- Balance tracking with self compassion: use data to inform helpful changes, not to judge or shame yourself. If tracking cranks up anxiety or obsession, dial back frequency or take breaks. Remember numbers are tools, not verdicts on your worth or resilience.
Final Words
In the action, you learned practical ways to track stress: quick journals with a 0–10 score, short HR and HRV snapshots, wearables and contactless sensors, cortisol checks, app‑based EMA, basic data cleaning, ML insights, and the value of personal baselines and privacy safeguards.
Try one small experiment: pair a morning HRV snapshot with a short journal for two weeks, note patterns, then tweak sleep, hydration, or workload.
Keep testing what helps. These stress response tracking techniques give clear clues so you can make smarter, real‑time choices and feel more in control.
FAQ
Q: What are the 4 types of stress response? / What are the 5 stress responses?
A: The 4 types of stress response are fight, flight, freeze, and appease. Some models add a fifth, tend-and-befriend or shutdown, describing social calming or passive withdrawal.
Q: What are the methods of monitoring stress?
A: The methods of monitoring stress are short daily journals and surveys, wearables tracking heart rate and HRV, respiration and skin conductance sensors, EMA apps, and occasional saliva or hair cortisol tests.
Q: What are the 5 R’s of stress management?
A: The 5 R’s of stress management are recognize triggers, reduce exposure or intensity, respond with coping skills, recover with rest and routines, and reflect to spot patterns and adjust plans.