


Think the scale tells the whole story? Think again.
Most people track nutrition by stepping on the scale, but real progress shows up in many places.
Objective numbers like body composition and lab tests, plus daily signals like steady energy and smooth digestion, give a fuller picture.
Set a baseline, track a few key markers, and treat changes as small experiments.
You’ll spot useful patterns fast and know whether your plan is actually working—or just wasting time—so you can adjust with confidence.
Key Indicators That Show Your Nutrition Plan Is Working

Most people track nutrition by stepping on the scale, but that’s just one piece of a much bigger picture. Real progress shows up across multiple markers, and watching the right ones helps you spot patterns fast and figure out whether your current approach is actually moving the needle or just wasting your time.
Different types of indicators work together. Objective metrics like body composition and lab results give you hard numbers that prove something’s changing inside. Subjective signals like how steady your energy feels or how well your digestion runs tell you whether your body’s actually tolerating and using the food you’re eating. When you track both, you catch meaningful changes early and make decisions with confidence instead of guesswork.
Setting a baseline early gives you something solid to compare against. Record your starting values across a few domains (waist circumference, fasting glucose, mood patterns, sleep quality) and you’ve got a snapshot you can pull up two weeks, one month, or three months later. Small improvements across multiple markers add up. And they often show up before the big visible changes do.
The six most recognized markers:
- Body composition shifts — less fat, more lean tissue, or a smaller waist measurement
- Lab markers — fasting glucose, HbA1c, lipid panel values, inflammatory markers like CRP
- Digestion quality — regular bowel movements, less bloating, comfortable fullness signals
- Mood and mental clarity — fewer crashes, sharper focus, emotions that don’t swing wildly
- Energy consistency — steady output from morning to evening without needing stimulants to survive
- Performance ability — strength gains, faster recovery, better endurance, improved workout output
Objective Metrics for Evaluating Nutrition Outcomes
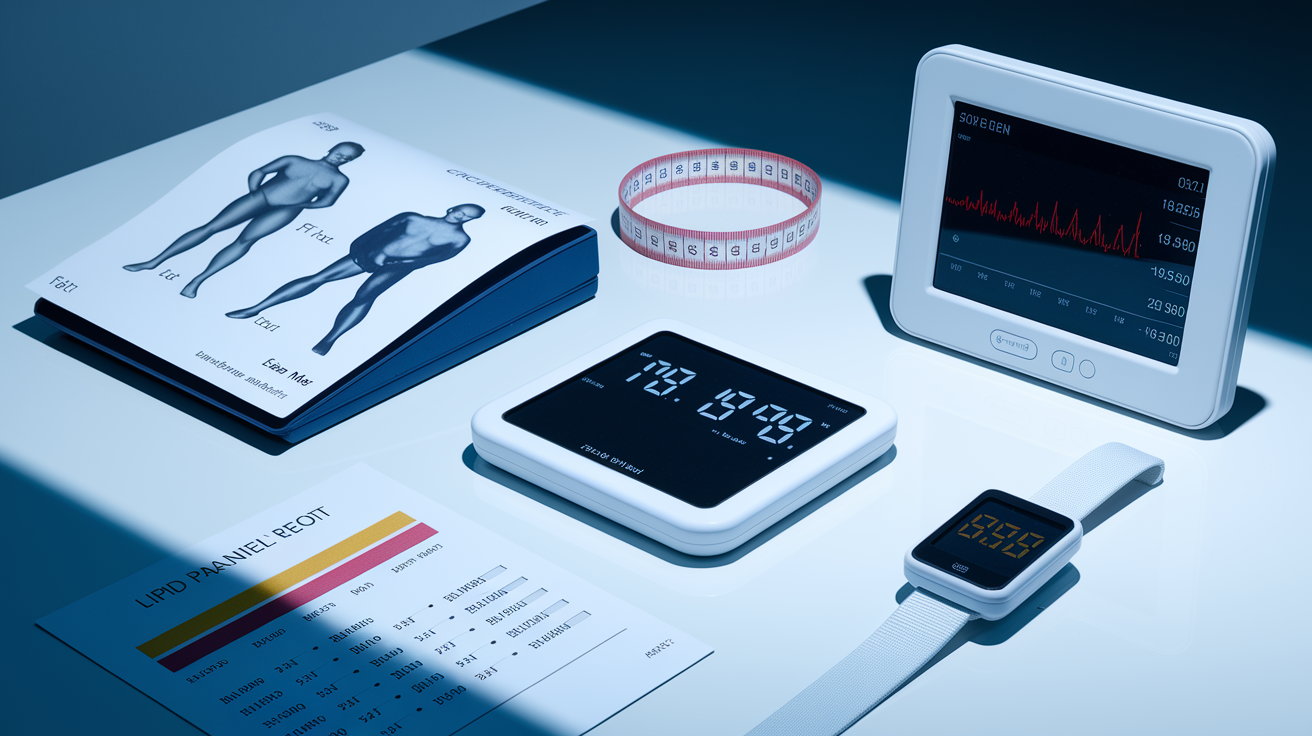
Objective measures remove the guesswork. Numbers on a lab report, tape measure, or body composition scanner tell you exactly how much your body has shifted since your last check. These metrics anchor your assessment and catch subtle progress that feelings alone might miss, especially when motivation’s low or results seem slow.
Body composition tools and clinical biomarkers form the core. DEXA scans deliver precise fat mass and lean mass percentages across different body regions. Waist to hip ratio and waist circumference in centimeters work as simple proxies for visceral fat and cardiometabolic risk. Blood tests capture micronutrient status, metabolic markers like fasting glucose or HbA1c, and lipid profiles including LDL, HDL, total cholesterol, and triglycerides. Resting metabolic rate assessments show how many calories your body burns at rest and help refine intake targets. All of these generate reproducible data points that reveal trends when you measure consistently over weeks or months.
Five objective metrics worth tracking:
-
Body weight and body mass index (BMI) — baseline and weekly or biweekly weigh-ins on the same scale, same time of day, under similar conditions to cut down on variability.
-
Body composition percentages — percent body fat and lean mass measured by bioelectrical impedance analysis (BIA), skinfold calipers, or DEXA every four to twelve weeks depending on goals and budget.
-
Waist and hip measurements — tape measure in centimeters to track central adiposity. Measure monthly and compare to baseline to spot trends in visceral fat.
-
Blood glucose control — fasting glucose via home glucometer or lab test, continuous glucose monitor (CGM) for real time patterns, and HbA1c via lab every three months to assess glycemic trends over time.
-
Lipid and inflammatory panels — total cholesterol, LDL, HDL, triglycerides, and high sensitivity CRP ordered at baseline and rechecked six to twelve weeks after major dietary changes to evaluate cardiovascular and inflammatory response.
Subjective Indicators and Daily Wellness Signals

Subjective feedback often shifts before objective measurements catch up. Noticing how your body feels day to day reveals whether your current nutrition supports you or drains you. These signals guide quick adjustments and help you avoid waiting weeks for a lab report to confirm what your energy, mood, and digestion already told you.
Improved satiety signals appear when meals satisfy hunger for several hours without cravings or rapid crashes. Stable daily energy means waking refreshed, maintaining focus through midday, and finishing the evening without relying on caffeine or sugar to push through. Smooth digestion shows up as regular bowel movements, minimal bloating or gas, and comfortable fullness after eating. Emotional steadiness includes fewer mood swings, better stress tolerance, and consistent motivation. Reduced inflammation sensations (joint stiffness, puffiness in fingers or ankles, persistent low grade discomfort) often ease within days to weeks of removing trigger foods or balancing macronutrients.
Tracking subjective signs works best with simple daily notes. A quick check in each morning or evening, rating energy, mood, digestion, and sleep on a scale of one to five or jotting down one sentence observations, builds a log that reveals patterns faster than memory alone. When three or four subjective markers improve together over a week or two, you’ve got strong early evidence that your nutrition plan is working, even if the scale or lab numbers haven’t moved yet.
Tools and Methods for Tracking Nutrition Progress

Reliable tools turn vague impressions into trackable data. Choosing the right mix of low tech and high tech options depends on your goals, budget, and how much detail you need to stay motivated or troubleshoot stalls. Most effective tracking combines at least one intake tool, one body measurement device, and one symptom or performance log.
Digital food logs and apps simplify intake tracking by storing portion sizes, macronutrient totals, and meal timing in one place. Continuous glucose monitors provide real time feedback on how specific foods affect blood sugar, helping you spot spikes or crashes that energy alone might not reveal. Wearables that track heart rate variability, sleep stages, and recovery scores add context to how well your body adapts to your current nutrition and training load. Elimination style self assessments (removing a suspected trigger food for two weeks and reintroducing it while monitoring symptoms) offer low cost insight into individual tolerances without needing a lab test.
| Tool Type | What It Measures | When It’s Useful |
|---|---|---|
| Digital scale and tape measure | Body weight, waist/hip circumference | Weekly or biweekly tracking for weight or body shape goals |
| BIA device or DEXA scan | Percent body fat, lean mass | Every 4–12 weeks to confirm composition changes |
| Home glucometer or CGM | Blood glucose levels, glycemic variability | Daily or real time monitoring for metabolic or energy goals |
| Food diary or mobile app | Intake patterns, portion sizes, adherence | 3–7 day logs at baseline and periodic spot checks for accountability |
Understanding Timelines and Expected Progress Patterns
Different markers move on different schedules. Knowing which changes appear quickly and which take months prevents frustration and helps you stay consistent when visible results lag behind invisible improvements. Realistic timelines also guide when to reassess and adjust rather than abandoning a plan too early.
Some shifts surface within days. Energy levels often stabilize and digestion smooths out in the first week or two after improving meal timing, balancing macronutrients, or removing a trigger food. Blood glucose variability measured by a continuous monitor can show tighter control within three to seven days of consistent carbohydrate timing or portion adjustments. Other markers require weeks or months. Body composition changes (measurable fat loss or lean mass gains) typically need four to twelve weeks of consistent nutrition and training to register on a scan or become visible. Blood biomarkers like HbA1c reflect the prior eight to twelve weeks, so expect to wait at least three months before rechecking after a dietary intervention. Lipid panels often shift meaningfully six to twelve weeks after major changes in fat quality or total intake.
Typical timelines for measurable changes:
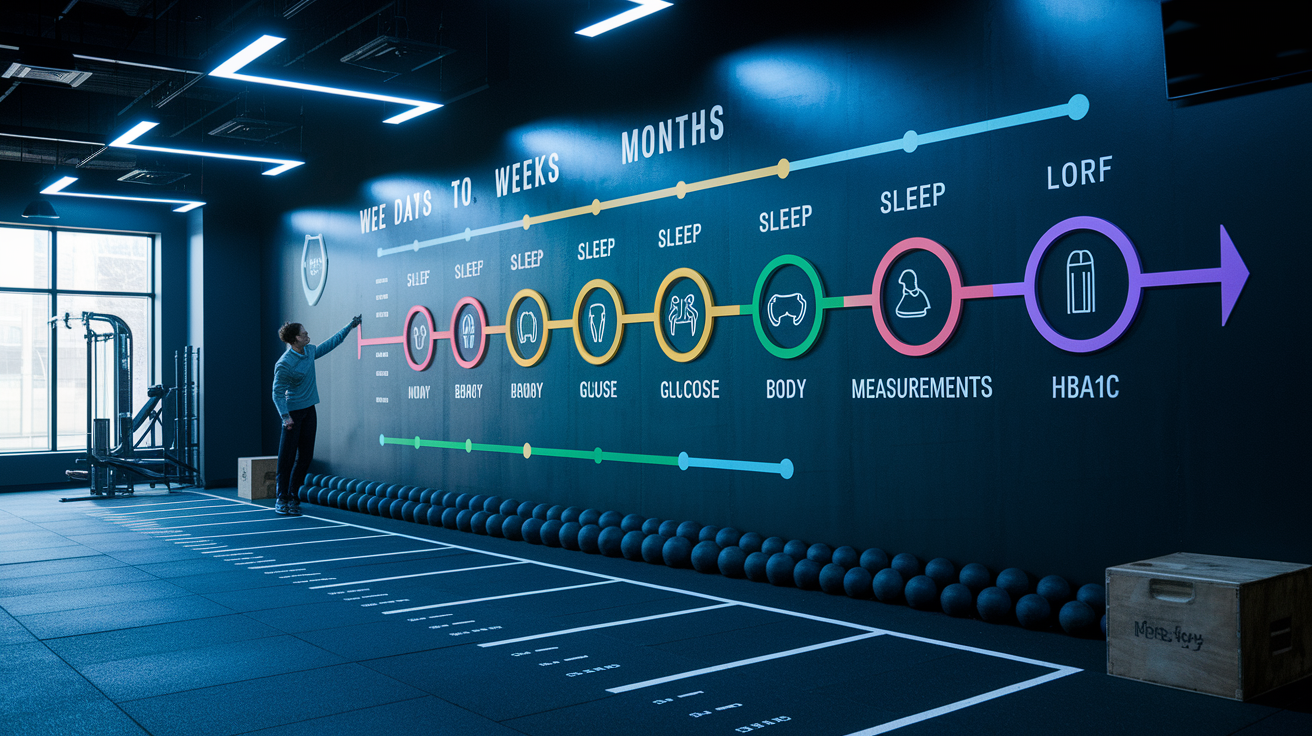
- Days to two weeks — subjective improvements in energy, appetite control, digestion regularity, and sleep quality. Initial blood glucose pattern shifts visible on continuous monitoring.
- Two to eight weeks — early changes in fasting glucose, some inflammatory markers like CRP, hydration status, and initial trends in body weight or circumference measurements.
- Eight to twelve weeks — clinically meaningful shifts in HbA1c, lipid panel values, body composition percentages, and functional performance metrics like strength or endurance.
- Three to six months and beyond — sustained body composition changes, micronutrient repletion in cases of deficiency, long term cardiovascular and metabolic risk reductions, and stable behavior patterns that support maintenance.
How to Interpret Data and Adjust Your Nutrition Plan
Interpreting tracking data well means looking at trends rather than fixating on single measurements. One high fasting glucose reading or a temporary weight jump after a salty meal doesn’t define progress. Patterns across multiple days or weeks reveal the real story. Combine objective numbers with subjective feedback to triangulate what’s working and what needs to change.
Start by comparing your current values to your baseline and to any interim targets you set. Calculate absolute change and percent change to quantify progress. Dropping from 82 kilograms to 78 kilograms equals a four kilogram loss or roughly 5 percent of starting weight over twelve weeks. Track rate of change as well. Losing half a kilogram per week over a month suggests steady progress. Losing two kilograms in one week followed by three weeks of no change might indicate water fluctuation rather than fat loss. Look for consistency across domains. If your weight stays flat but your waist shrinks two centimeters and your strength increases, body composition is improving even when the scale doesn’t move. If weight drops but energy crashes and digestion worsens, the plan may be too restrictive or missing key nutrients.
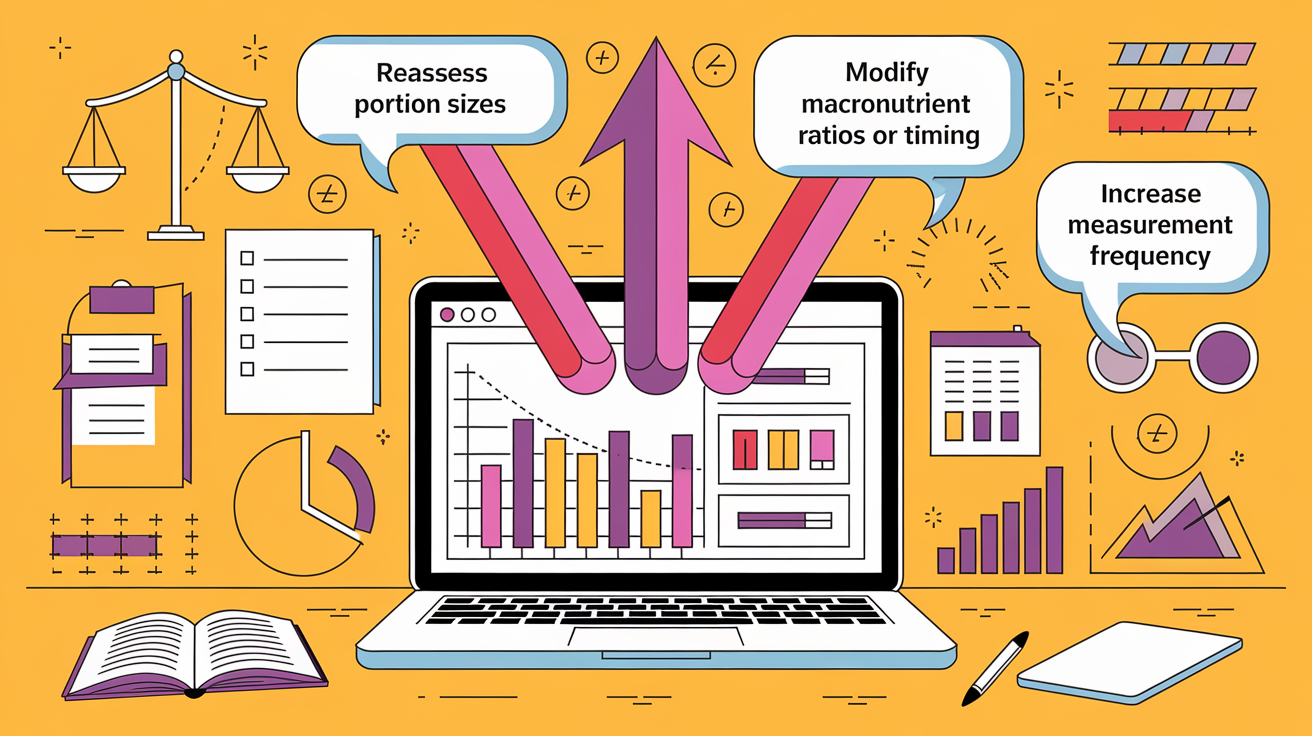
When data suggests a stall or unwanted trend, use these three adjustment strategies:
-
Reassess portion sizes and adherence — track intake for three to seven days to confirm you’re hitting your intended macronutrient and calorie targets. Small drifts in portion size or unplanned snacks add up quickly.
-
Modify macronutrient ratios or meal timing — if energy dips mid afternoon, shift more carbohydrates to earlier meals. If fasting glucose stays elevated, reduce evening carbohydrate load or test smaller, more frequent meals.
-
Increase measurement frequency temporarily — add daily weigh ins for two weeks, log symptoms every evening, or wear a continuous glucose monitor for ten days to gather more granular data and identify hidden patterns before making larger changes.
Final Words
You jump right into the signs that show a nutrition plan is working: body composition, labs, steady energy, digestion, mood, and performance. We also covered hard metrics, daily signals, tracking tools, realistic timelines, and simple ways to adjust when things stall.
Pick a small set of measures, track them consistently, and compare trends, not single days. Treat tweaks like short experiments.
Try two objective metrics and two daily signals for 4 to 12 weeks to learn how to measure nutrition effectiveness for you. You’ll end up with clearer clues and a practical next step.
FAQ
Q: What is the 4 4 9 rule in nutrition?
A: The 4 4 9 rule in nutrition states that protein and carbohydrates each provide 4 calories per gram, while fat provides 9 calories per gram, useful for calculating food energy.
Q: What is the 3 3 3 rule for eating?
A: The 3 3 3 rule for eating is a simple guideline to pace meals or manage cravings; common versions suggest spacing meals three hours apart, pausing three minutes before eating, or including three food groups.
Q: What are the 4 methods of nutrition assessment?
A: The 4 methods of nutrition assessment are anthropometry (body measures), biochemical or lab tests, clinical examination, and dietary intake assessment, which together reveal nutritional status and needs.
Q: What is the 70/30 rule in food?
A: The 70/30 rule in food is a flexible guideline suggesting roughly 70% of eating focus on nutrient-dense whole foods and 30% allow more flexible or enjoyable choices for balance.