



What if the reason you wake up groggy has nothing to do with how many hours you slept?
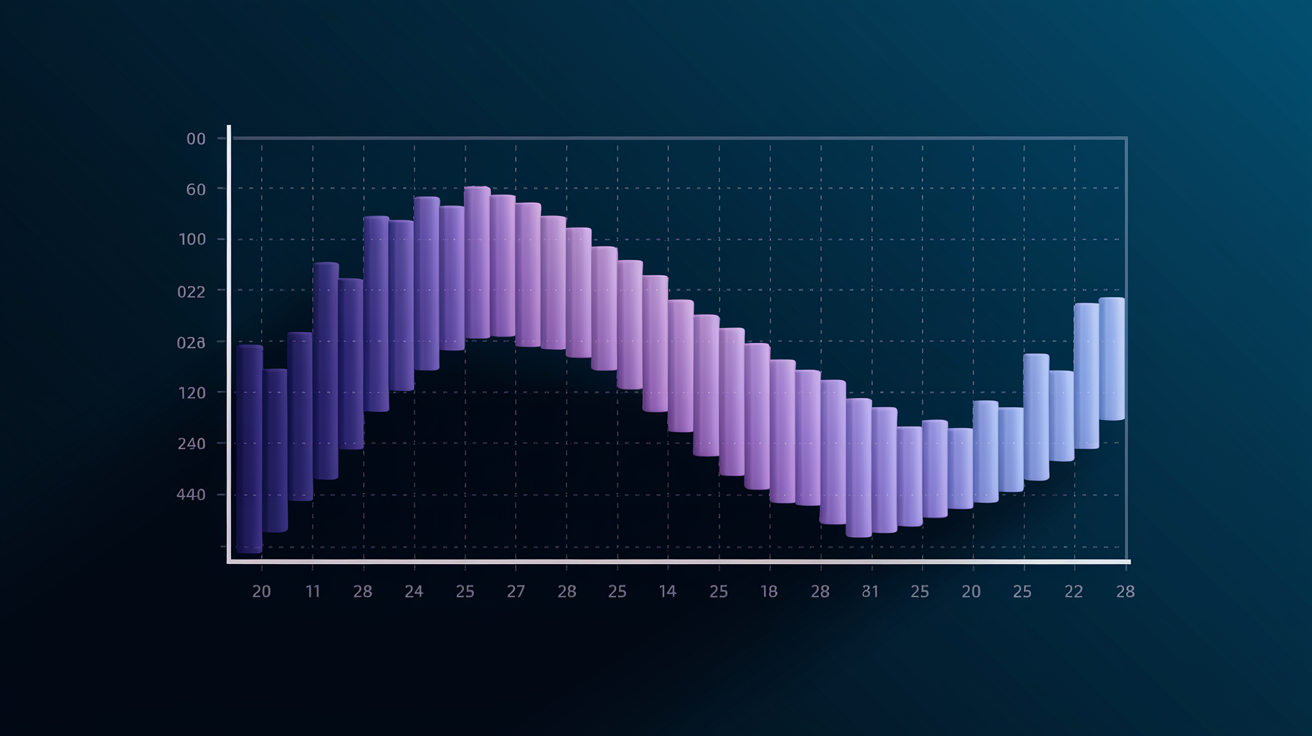
This sleep cycle graphic lays out a typical adult night, showing when deep sleep happens, when REM stretches longer near morning, and where brief wakeups pop up.
Read on to learn how to read the chart, what each stage likely does for your body, and three tiny tests you can try to spot patterns in your sleep.
Think of it as a map you can use to run small experiments, not a medical report.
Your Night’s Sleep Stages At A Glance
| Eight-Hour Sleep-Stage Chart (Elapsed Hours 0-8) | ||||||||
|---|---|---|---|---|---|---|---|---|
| Stage | 0h | 1h | 2h | 3h | 4h | 5h | 6h | 7h-8h |
| Awake | ● | · | · | · | · | |||
| REM (purple) | ▬ | ▬▬ | ▬▬▬ | ▬▬▬▬ | ||||
| N1 (pale blue) | ▬ | · | · | · | · | · | · | · |
| N2 (medium blue) | ▬ | ▬ | ▬ | ▬▬ | ▬▬ | ▬▬ | ▬▬ | |
| N3 (dark navy) | ▬▬▬ | ▬▬ | ▬▬▬ | ▬ | ▬ | |||
| Cycle 1 | Cycle 2 | Cycle 3 | Cycle 4 | Cycle 5 (4-6 cycles typical) | ||||||||
Legend: Orange means Awake, pale blue means N1, medium blue means N2, dark navy means N3, and purple means REM. Stage abbreviations and line position both mark each level, so you can still read the chart clearly in black and white.
Sleep cycles typically run 90 to 110 minutes. You’ll get more deep sleep early in the night, and REM periods stretch longer as morning gets closer.
This chart moves between levels as the night goes on. Early on, the line dips into N3 pretty fast and stays there a while. Later, it spends more time up near REM, with only quick dips back into lighter NREM stages.
Worth saying clearly, this chart is a representative adult pattern, not a diagnostic record. It won’t match your exact night. Think of it as a model built from common timing ranges, not a prediction of what your brain will actually do tonight.
[Download PNG] · [Download PDF]
Alt text: Eight-hour sleep-stage chart showing five cycles through N1, N2, N3, and REM, with deep sleep concentrated early, longer REM periods later, and brief awakenings.
Source note: this illustration is a representative adult-night model based on standard sleep-stage timing ranges. It’s not drawn from one individual’s sleep study.
Reading The Four Stages Shown In The Chart

Lower positions on the chart mean deeper NREM sleep, so N3 sits at the bottom. REM gets its own labelled level near the top, close to Awake, because your brain activity during REM actually looks a lot like it does when you’re awake, even though your body stays deeply still.
Pale Blue N1: Light Dozing
N1 sits right below Awake on the chart, shown in pale blue. It’s a small slice of the night, around 5% of total sleep, and it usually only lasts a few minutes at a stretch. This is the drifting-off stage, marked by theta waves and that hazy, half-aware feeling. You could still be nudged awake pretty easily here. Think of N1 as the doorway between being awake and actually settling into sleep.
Medium Blue N2: Stable Light Sleep
N2 is the medium blue band, and it’s where you’ll spend the biggest chunk of your night, roughly 40 to 55% of total sleep. This stage brings sleep spindles and K-complexes, those brief bursts of brain activity that show up on the wave pattern. Your heart rate slows down, you become less responsive to noise around you, and your brain gets busy consolidating memories. N2 is basically the anchor stage holding the rest of your sleep architecture together.
Dark Navy N3: Deep Sleep
N3 is the lowest, dark navy level on the chart, and it’s the hardest stage to wake from. It makes up about 10 to 20% of total sleep (some sources say 13 to 23%), and slow delta waves dominate here. Heart rate and breathing drop to their lowest points. This is your body’s repair shop, handling muscle recovery, bone health, and immune support. Wake someone from N3 and they’ll probably feel foggy and disoriented for a bit.
Purple REM: Active Dreaming
REM shows up in purple, positioned close to Awake but kept separate from N1 since the brain activity is so different in character. It accounts for about 20 to 25% of total sleep and comes with rapid eye movements, wake-like brain waves, and your most vivid dreaming. Heart rate and body temperature shift during REM, and muscle atonia kicks in, temporarily limiting your muscles so you don’t physically act out what’s happening in the dream. REM also plays a big role in emotional processing, learning, and memory.
How To Read Transitions In A Typical Hypnogram

A hypn
Final Words
You’ve seen the eight-hour chart showing Awake, REM, N1, N2, and N3 across five representative cycles, with a legend, clear labels, and downloadable PNG and PDF.
The piece explains what each stage does, how to read the hypnogram’s staircase, and that cycles average about 90 to 110 minutes with normal brief awakenings.
Keep the sleep cycle graphic handy as a reference when you track nights. Try one small change, watch for a pattern, and you’ll likely notice improvement.
FAQ
Q: What is a good sleep cycle graph?
A: A good sleep cycle graph shows elapsed hours across the night with labeled stages (Awake, REM, N1, N2, N3), five representative cycles, brief awakenings, and a clear legend for colours or patterns.
Q: What is the 3-3-3 rule for sleep?
A: The 3-3-3 rule for sleep is not a single standardized term; different sources use it for things like infant sleep training, nap timing, or schedule shifts—check the specific context or source before using it.
Q: What are the 5 stages of sleep cycles?
A: The five stages of sleep cycles are Awake, N1 (light dozing), N2 (stable light sleep with spindles), N3 (deep restorative slow-wave sleep), and REM (vivid dreaming, memory and emotional processing).
Q: What is the 30-60-90 rule for sleep?
A: The 30-60-90 rule for sleep refers to nap lengths: ~30 minutes for light rest without deep sleep, ~60 minutes including some deep N3, and ~90 minutes for a full cycle that often reduces grogginess.