

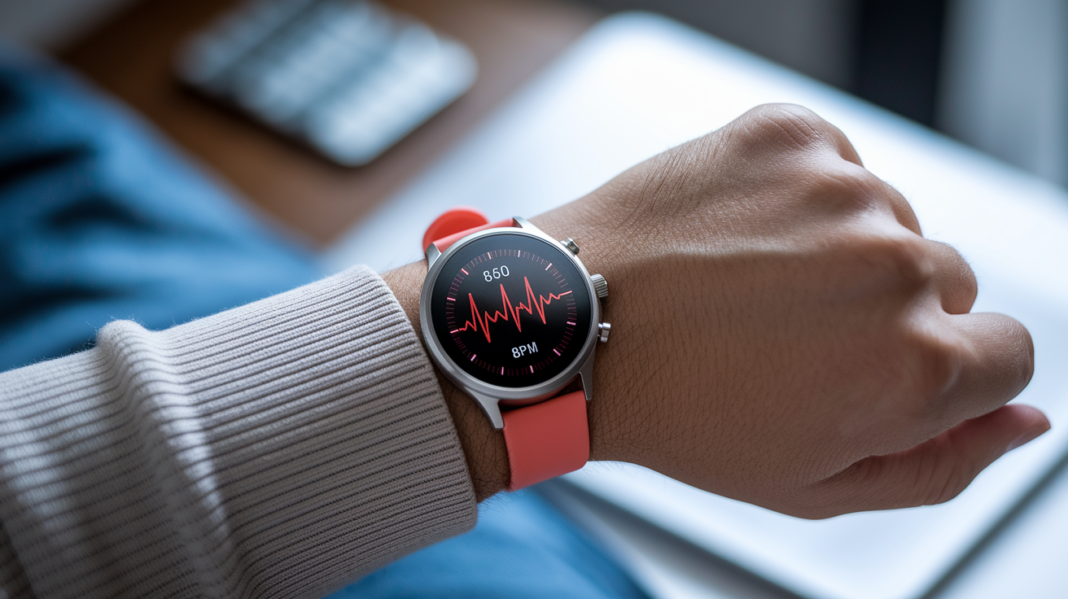

Could your morning resting heart rate be the clearest sign you’re recovered, or the thing you’re misreading every day?
Resting heart rate and heart rate recovery are different signals that tell different stories.
One unfolds across days.
The other plays out in minutes after exercise.
This post will show you how to spot the patterns that matter, what small changes usually mean, and one simple tracking test you can try tomorrow morning.
Think of it like following a weather pattern for your body.
Small shifts can warn you to back off, or tell you to keep going.
What Your Resting Pulse Reveals About Recovery

Resting heart rate (RHR) is simply how many times your heart beats per minute while you’re calm and physically still. Heart rate recovery (HRR) is a different thing entirely. It’s how fast your heart rate drops after you stop exercising. They’re related, but they run on completely different clocks. RHR tells a story over days. HRR tells a story over seconds and minutes.
So what’s the short answer? If your morning RHR is sitting close to your usual personal baseline, that’s generally a decent sign your body bounced back from yesterday. If it’s staying elevated day after day, that’s worth paying attention to. It could mean you haven’t fully recovered, or something else is putting stress on your system, like poor sleep, dehydration, or the start of an illness.
Here’s the tricky part though. A low RHR by itself doesn’t prove you’re well recovered. Someone can have genuinely fast HRR right after a workout, snapping back to normal within a minute or two, and still wake up the next morning with a resting pulse that’s noticeably higher than usual. Fitness level and baseline pulse matter, but so does day to day variability. Chasing a number from a textbook range (the often cited 60 to 100 bpm for most adults, or 40 to 60 bpm for very fit people) misses the point. Your own trend is what actually counts.
| Signal | Example Personal-Baseline Pattern | What It May Mean | Suggested Response |
|---|---|---|---|
| Within normal personal range | RHR matches your typical morning average | Likely adequate recovery from recent training | Continue as planned |
| Small daily bump | 2 to 3 bpm above your usual baseline, one morning only | Normal day-to-day variability | No action needed, keep tracking |
| Sustained elevation | More than 5 bpm above baseline for two or more mornings | Possible incomplete recovery or accumulating fatigue | Review sleep, load, and other factors, consider easing training |
| Sudden spike | 8 to 10 bpm jump from one day to the next | Possible acute strain, illness, or major recovery disruption | Investigate cause, scale back activity, watch for symptoms |
Remember, these patterns are meant for comparing against your own baseline, not as fixed medical cutoffs. What counts as a meaningful change for one person might be ordinary noise for another.
Why Resting Heart Rate Changes During Recovery
(((alt-img2)))
To understand why your resting pulse moves around, it helps to know a basic bit of heart math. Cardiac output, the amount of blood your heart pumps per minute, equals stroke volume (how much blood gets pumped out with each beat) multiplied by heart rate. Written out: cardiac output (mL/min) = stroke volume (mL/beat) × heart rate (beats/min). If your heart gets better at pumping more blood per beat, it doesn’t need to beat as often to move the same amount of blood.
That’s exactly what aerobic training does over time. Regular endurance work can increase stroke volume and improve cardiorespiratory efficiency, meaning your heart becomes a more effective pump. Many people notice a measurable drop in RHR within roughly 4 to 8 weeks of consistent aerobic training. On top of that, training builds up parasympathetic activity, your “rest and digest” nervous system working more efficiently in the background, even when you’re not exercising.
Right after exercise, your body shifts gears fast. In the first 30 to 60 seconds, sympathetic activity (the “go” system that ramped up during exercise) starts pulling back, while the parasympathetic system starts reactivating. This fast phase is why heart rate often drops quickly right after you stop moving, before settling into a slower decline over the following minutes.
Recovery factor checklist
- Recent training intensity or volume
- Inadequate sleep
- Psychological stress
- Dehydration or heat exposure
- Insufficient nutrition or glycogen replacement
- Temporary illness
- Stimulants or alcohol
These factors rarely show up alone. More often, it’s a combination, like a hard interval session plus a short night’s sleep plus a stressful week at work. Keep this list in mind. We’ll point back to it later instead of repeating it.
Measuring Resting Heart Rate for Reliable Recovery Data
(((alt-img3)))
Getting a trustworthy RHR number comes down to consistency. The method matters less than doing it the same way every single time.
Manual Morning Pulse Measurement
Find your carotid pulse by placing your index and middle fingers gently on your neck, between the windpipe and the large muscle running along the side. Press lightly, you don’t need much pressure to feel it. Count the beats for 10 seconds, then multiply by 6 to get your beats per minute. If the rhythm feels uneven or irregular, counting for a longer stretch, like 30 or 60 seconds, can give you more confidence in the number. But don’t try to diagnose an irregular rhythm yourself. That’s a job for a professional.
Measuring With a Wearable
If you’re using a fitness tracker or heart rate monitor, put it on as soon as you wake up and stay still in bed, avoiding movement, caffeine, and any exercise. Some devices also generate an overnight average from hours of passive data while you sleep. That overnight number isn’t the same thing as your single waking measurement, so don’t treat them interchangeably. Know which one your app is showing you.
Keeping Collection Conditions Consistent
Small changes in how you measure can shift the number more than you’d expect. Same time each morning, same position
Final Words
In the action, we showed how resting pulse and post-exercise drops (RHR and HRR) work on different time scales, how to measure them, and what to do when numbers shift.
Use a personal baseline, check likely causes like sleep, training load, hydration, and stress, and run simple tests (morning RHR, one-minute HRR) so you’ll get comparable results.
Tracking resting heart rate and recovery over days turns numbers into clear signals you can act on. Try one small change this week and reassess. Small experiments win.
FAQ
Q: What is a good resting heart rate?
A: A good resting heart rate is personal; typical adult ranges are about 60–100 bpm, and well-trained people often sit around 40–60 bpm. Track your own baseline and watch trends, not single readings.
Q: Is a heart rate around 37–40 bpm during recovery or sleep a concern?
A: A heart rate around 37–40 bpm during recovery or sleep can be normal for very fit people or deep sleep, but seek evaluation if you have dizziness, fainting, shortness of breath, or a sudden unexplained change.
Q: Why is my resting heart rate high after exercise?
A: A high resting heart rate after exercise usually means recovery is incomplete or other strain is present; common causes are hard training, poor sleep, dehydration, heat, illness, stimulants, or stress. Repeat the measure and compare to your baseline.