



What if your recovery chart is lying to you?
Recovery Trend Analysis is the smarter way to find out.
This post walks you through a simple workflow: define what recovery means here, pick the right metrics and baseline, separate early signals from real outcomes, visualize trends to cut noise, test small fixes, then reassess.
You’ll learn practical checks and quick experiments you can try this week to see if progress is real or just a blip.
What Recovery Patterns Measure and How to Analyse It
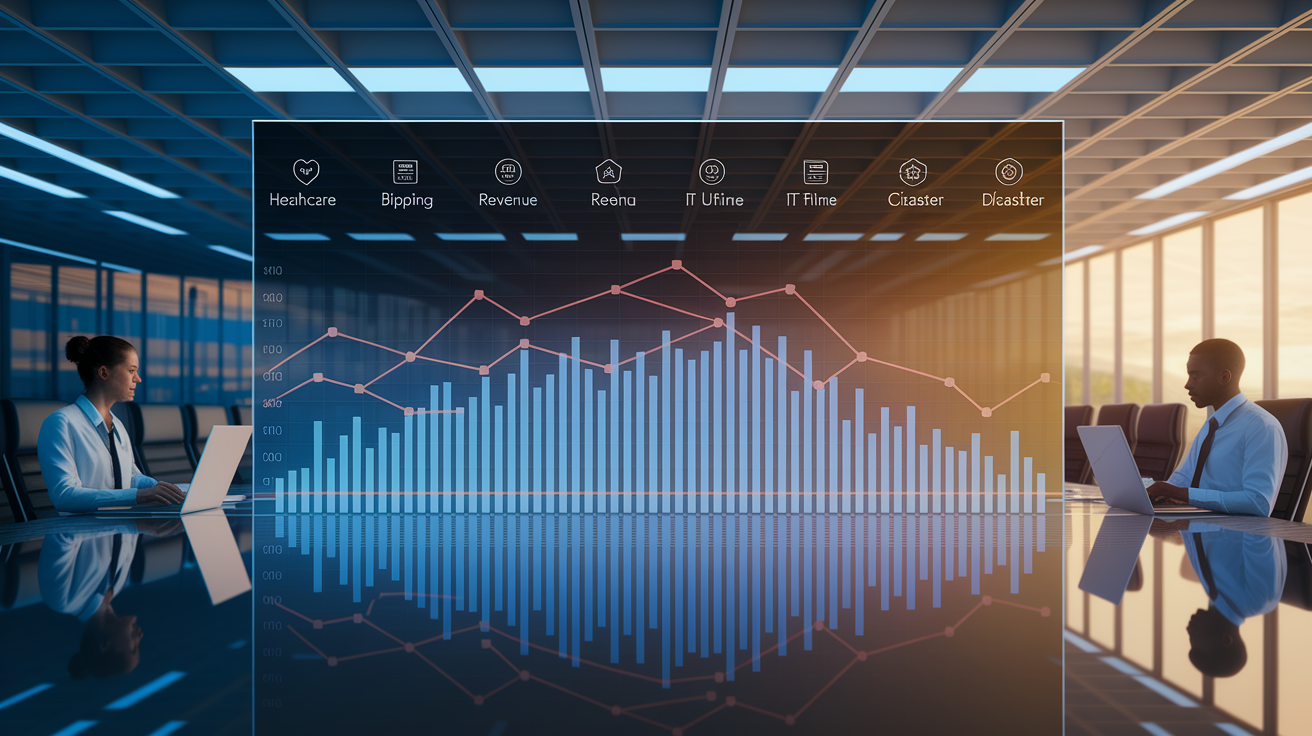
Recovery trend analysis tracks whether things are getting better after something knocked them off course. Think illness, injury, a bad quarter, an outage, a disaster, or a regional economic shock. The core question stays the same: is recovery improving, stalling, reversing, or settling into some new, different normal?
You only get an answer to that question through a repeatable workflow. Define what recovery means for this specific situation, set a dated baseline to compare against, measure the right KPIs at a sensible cadence, visualise the trend to cut through daily noise, model it when you need to forecast or test an intervention, act on what you find, then reassess as new data comes in. Most teams carry this out with one of three setups: spreadsheets for lightweight tracking, Python or R when the modelling gets more serious, or dashboards like Tableau or Power BI for ongoing, shared monitoring.
Part of this workflow means separating leading indicators (early signals that hint at where things are headed, like HRV or customer search intent) from lagging outcomes (the results you actually care about, like return to play date or quarterly revenue). Neither tells the full story alone. A leading indicator can wobble without a real outcome change, and a lagging outcome can look fine while early warning signs are already flashing underneath. The table below gives a quick orientation across different fields, before later sections dig into specific metric selection and thresholds.
| Context | Recovery question | Example KPI | Typical timeframe |
|---|---|---|---|
| Health or sport | Is the body or athlete returning to normal function? | Readiness score, pain level, HRV, time to functional recovery | Days to months |
| Business or economics | Is revenue or spending returning to pre-crisis levels? | Revenue, employment, time to 90 to 95% of baseline | Months |
| IT | Are systems and services back to full operation? | MTTR, downtime, incidents, % services restored | Minutes to weeks |
| Post disaster operations | Is infrastructure and support reaching affected people? | Infrastructure availability, service restoration, population reached | Weeks to years |
Why Recovery Trends Become Noisy, Delayed, or Misleading

Recovery is almost never a straight line upward. Treating it like one is where most reading errors start. Within any group, some people, customers, regions, or systems bounce back fast, most recover somewhere in the middle, and a smaller group lags well behind. Lump them all together into one average and you get a smooth looking curve that doesn’t match anyone’s actual experience.
There’s also a timing gap worth watching for. Leading indicators move first, outcomes move later, and the delay between them isn’t fixed. A drop in consumer confidence today might not show up in spending data for weeks. A dip in HRV might not translate into a setback for several days. If you only check the lagging number, you’ll notice the problem later than you could have.
Then there’s the question of whether a shift is real or just noise. A good historical example: fuel price volatility in 2008, 2010, and 2011 pushed a wave of interest toward hybrids and electric vehicles. It looked like a lasting shift in consumer behaviour. But once prices settled, demand drifted back toward SUVs. The “trend” was really a temporary reaction to pressure, not a structural change. Mistake one for the other and you end up with bad planning decisions.
Common reasons a recovery chart gives the wrong impression:
- Undefined or shifting baselines.
- Seasonality and calendar effects.
- Missing, delayed, or inconsistently entered data.
- Outliers and temporary shocks.
- Aggregating groups with different recovery paths.
- Confusing correlation with intervention effects.
- Treating a forecast as a certain outcome.
COVID-19 recovery trends are a clear, large scale example of this. Health conditions, government policy, consumer confidence, mobility patterns, supply constraints, and spending behaviour all moved on separate, overlapping timelines. No single chart captured the full picture, and teams that tried to read just one signal were often caught off guard by what another was already showing.
Choosing Recovery Metrics, Baselines, and Tracking Cadence
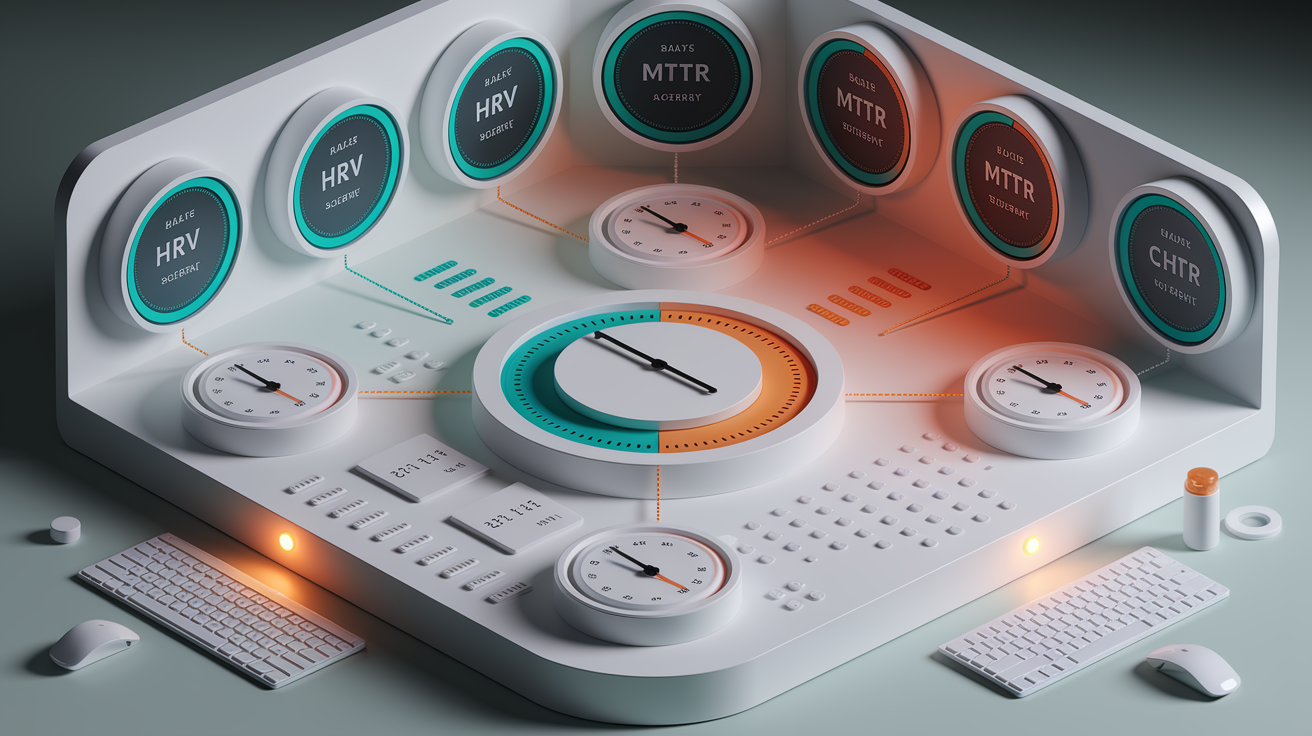
Picking the right KPI starts with matching the metric to the kind of recovery you’re actually watching. In health and sport, that often means time to return to activity, pain scored on a 0 to 10 scale, HRV in milliseconds, sleep efficiency, a 0 to 100 readiness score, functional improvement, and re-injury rate. These aren’t arbitrary numbers either. A readiness score above 80 is a common marker for full intensity return, a 10 to 20 percent HRV decline from a 28 day median is a reasonable alert line, and a 30 percent improvement in pain or function within 30 to 90 days is a useful rehab benchmark to plan around, though it should flex depending on the person and the injury.
Business and economic recovery tracking runs on a different set of numbers, but the logic stays the same: pick a measure, give it a target, and give that target a timeframe. Reaching 90 to 95 percent of pre-crisis revenue within three to six months is a common business continuity target. Unemployment rate change points, customer churn percentage, and time to recovery in months are the economic equivalents. For IT and disaster recovery work, mean time to recovery (MTTR), downtime as a percentage of total time, and incidents per 1,000 users are the standard trio, often paired with a target like cutting MTTR from four hours down to under one.
Whatever the field, the met
Final Words
in the action, recovery trend analysis checks whether recovery is improving, stalling, reversing, or shifting into a new pattern. It looks at direction, speed, consistency, and likely duration so you can separate real change from short-term noise.
Quick workflow: define → baseline → measure → visualise → model → act → reassess. Do that in a spreadsheet, with Python or R, or in a dashboard for ongoing monitoring.
Leading indicators give early clues; lagging outcomes show results. Use both, watch cohorts and timing, and use the table as a guide. Run small experiments—track, learn, adjust—and you’ll get clearer recovery trend analysis and steadier progress.
FAQ
Q: What is a trend analysis?
A: A trend analysis identifies whether a measure is improving, stalling, reversing, or shifting by tracking data over time to spot direction, speed, and consistency of change.
Q: What does the recovery model do?
A: The recovery model estimates the path and pace of recovery, comparing baselines, projecting likely outcomes, and guiding decisions about interventions and timing.
Q: What is a good recovery score?
A: A good recovery score depends on context. It usually means hitting a domain-specific target, for example readiness above 80, 90–95% revenue restored, or meaningful functional gains.
Q: What is the definition of recovery?
A: The definition of recovery is returning toward a baseline or a new stable state after a setback, measured with domain-specific indicators across short, medium, or long timeframes.