

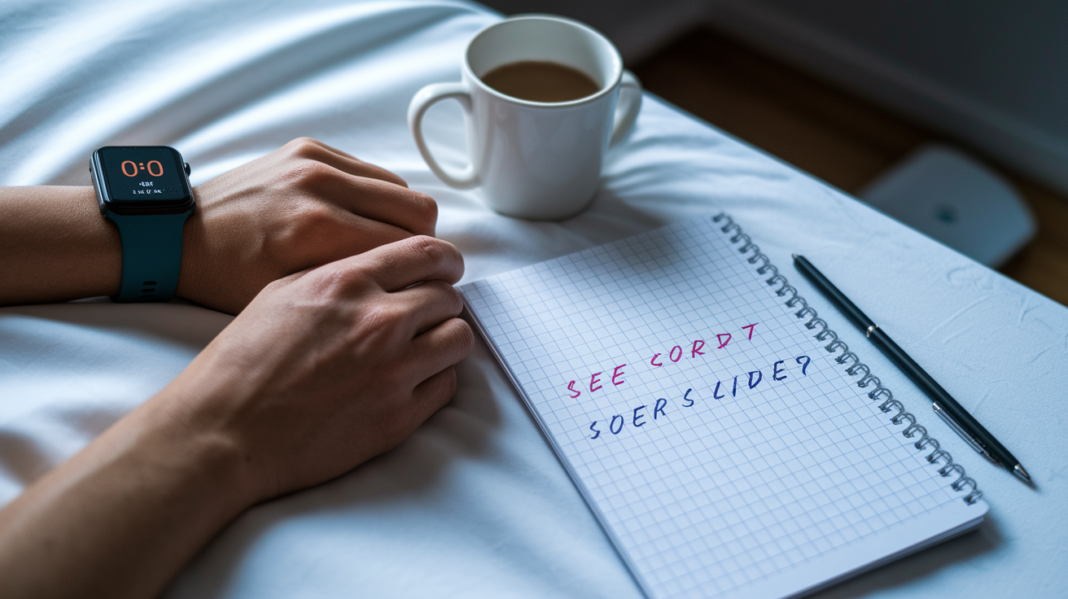

Skipping recovery checks is the fastest way to stall your progress.
But recovery doesn’t have to be guesswork.
This post gives a five-minute morning routine that mixes two objective numbers—heart rate variability and resting heart rate—with simple body signals: sleep quality, muscle soreness, mood, and a short warm-up performance check.
Do this check before you train and you’ll clearly see whether to push, scale back, or take an active recovery day.
Read on to learn the quick thresholds and easy actions you can try today.
Quick Answer: How To Assess Training Recovery Today

Assessing training recovery comes down to combining a few objective numbers with how your body actually feels. The objective side includes heart rate variability (HRV) and resting heart rate monitoring. The subjective side includes sleep quality, muscle soreness, and how your warm-up feels. Put them together and you’ve got a real-time recovery readiness score you can act on before you even start your session.
Here’s a simple morning check-in you can run through in under five minutes.
- Take your HRV and RHR on waking. Do this before you get out of bed, while you’re still lying down or just sitting up. Consistency in timing matters more than the exact method.
- Rate your sleep quality from 0 to 10. Don’t overthink it. Did you fall asleep easily? Did you wake up a lot? A quick gut check number works fine.
- Rate muscle soreness from 0 to 10. Zero means nothing, ten means you can barely move. Most training days will land somewhere in the low to mid range.
- Rate your mood and energy from 0 to 10. This is your subjective wellness questionnaire in miniature. Are you looking forward to training, or dreading it?
- Do a short warm-up performance check. A few easy reps, a short jog, or a light set at a familiar weight. Notice if it feels normal, heavy, or unusually easy.
So what do you do with all this? Here are the recovery thresholds worth knowing. An HRV drop of more than 10% from your baseline, an RHR increase of 3 to 5 beats per minute, soreness above 4 out of 10, or a performance drop of 2 to 5% are all flags worth paying attention to.
If most of your markers look normal, go ahead and train as planned. If two or more are flagged, scale back the volume or intensity for the day. And if most of your signals are pointing the wrong way, that’s your body asking for a rest day or some active recovery instead of pushing through.
Key Training Recovery Metrics Explained
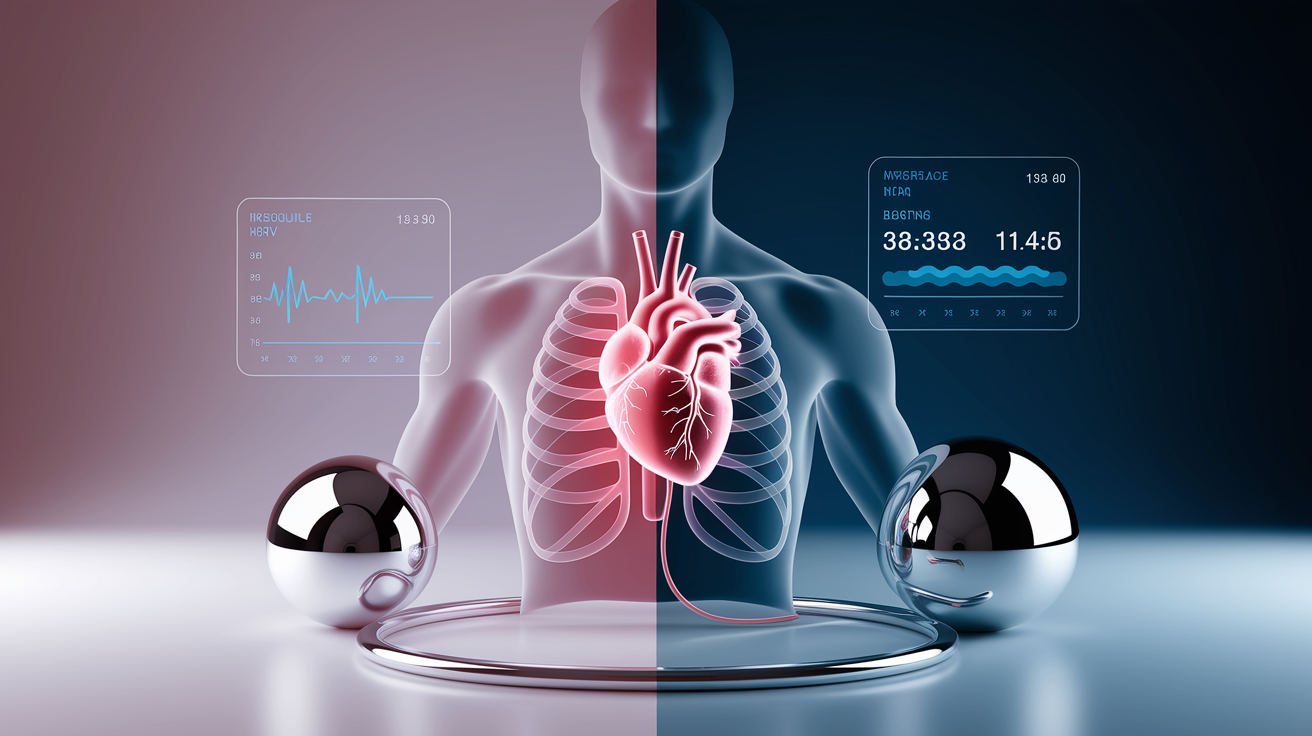
Two numbers do most of the heavy lifting here, heart rate variability and resting heart rate. Both get measured first thing in the morning, both reflect how your nervous system is handling stress, and both become far more useful once you know your own personal baseline rather than comparing yourself to some generic chart.
Heart Rate Variability (HRV)
HRV measures the tiny variations in time between each heartbeat, recorded in milliseconds. Sounds technical, but think of it like this: a flexible, well recovered nervous system creates more variation between beats, while a stressed or fatigued system creates a steadier, more rigid rhythm.
Reference ranges give you a rough starting point. Active adults often fall somewhere between 50 and 100 ms. Athletic high performers can run higher, sometimes 100 to 140+ ms. A reading below 30 ms is typically considered low and often signals poor recovery or high stress.
But here’s the thing, your own baseline matters more than any chart. Someone with a naturally lower HRV who stays consistent day to day is doing just fine. Watch HRV baseline trends over time, not single day snapshots.
Resting Heart Rate (RHR)
RHR reflects how efficiently your heart is working at rest, and it’s a solid window into systemic stress, whether that stress comes from hard training, poor sleep, or getting sick. Athletes and highly fit individuals often sit in the 40 to 55 bpm range. Average adults tend to fall between 60 and 75 bpm. Anything above 80 bpm may point to illness, low fitness, or overtraining.
The red flag isn’t the number itself, it’s the sudden change. A rise of 3 to 5 bpm or more above your normal baseline, especially if it shows up out of nowhere, is worth treating as a signal to back off.
Track both HRV and RHR each morning for 7 to 14 days before drawing conclusions. That window gives you a real baseline, which is what turns these numbers from interesting data into something you can actually use.
Performance And Neuromuscular Tests For Recovery Assessment

Heart based metrics tell you a lot, but they don’t always tell the whole story. Performance tests act as a kind of ground truth check, showing you how your muscles and nervous system are actually responding, not just how your heart rhythm looks on waking.
The countermovement jump test (CMJ) is one of the most accessible neuromuscular fatigue monitoring tools out there. It’s simple: a quick squat down and explosive jump up, measuring how high you get. Jump height tracking over time reveals fatigue trends that might not show up anywhere else. If your jump height falls more than 5% below your baseline, that’s a sign your nervous system needs lower intensity work or a bit more rest before the next hard session.
For those with access to more advanced setups, isometric strength tests, force plate measurements, and velocity based training metrics add another layer of precision. Power output monitoring during lifts, for example, can catch small drops in bar speed that your brain might not consciously notice, even on a day that feels “normal.”
You don’t need a lab to get useful information here. A simple field friendly test, like a submaximal lift at a known weight or a short jump test before your warm-up, can flag unexpected fatigue in under a minute. If the bar feels heavier than it should, or your jump feels flat, factor that into how hard you push that day.
Subjective Wellness Questionnaires And Soreness Scales
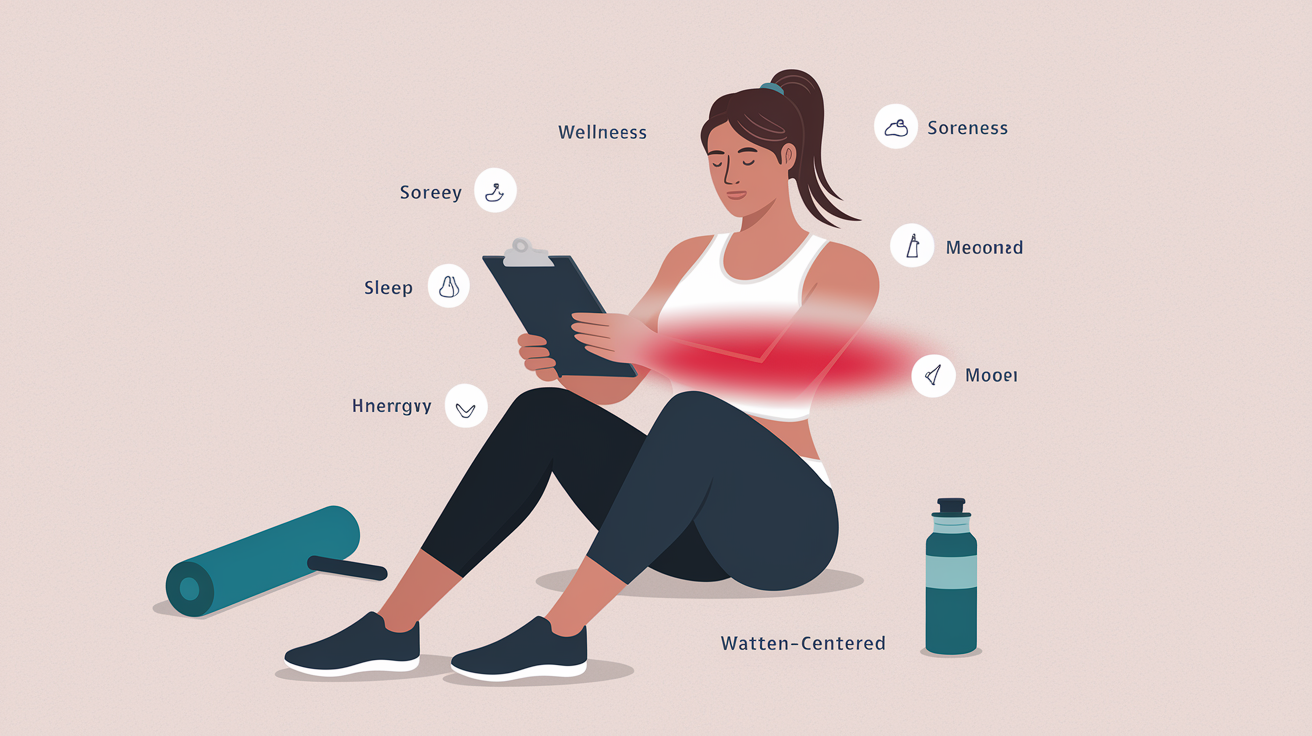
Numbers from wearables are useful, but they don’t capture everything. How you actually feel matters, and that’s where subjective wellness questionnaires and soreness scales come in. These are quick, low tech, and surprisingly reliable when used consistently.
A simple soreness scale works well here. Zero means no soreness at all. A score of 1 to 3 is mild, the kind of soreness you barely notice once you get moving. A score of 4 to 6 is moderate, and this is usually the point where it makes sense to modify your session, maybe lighter loads or shorter intervals. Anything from 7 to 10 is severe, and that’s a clear signal to avoid intense training altogether.
Final Words
Combine a few objective markers (HRV, RHR, sleep) with subjective ones (soreness, mood, performance) for a quick morning check-in.
Do a quick check: HRV/RHR on waking, rate sleep and soreness 0–10, note mood/energy, then a short warm-up check. Rule: most normal → train; two+ flagged → reduce; most flagged → rest or do active recovery.
Think of it as a loop: track, spot patterns, try small experiments. It shows how to assess training recovery for yourself. Try it for a week and you’ll get clearer, useful signals to guide your training.
FAQ
Q: How can I best recover from weightlifting?
A: The best way to recover from weightlifting is to combine quality sleep, protein-rich meals, hydration, gentle active recovery, and a morning check of HRV, resting heart rate, and soreness; reduce intensity if several markers flag.
Q: What is the 3-3-3 rule for training?
A: The 3-3-3 rule for training often means cycling three days of higher load, three days of lighter work or focused recovery, then reassess; use it as a simple block to manage fatigue and test progress.
Q: What is the golden hour after exercise?
A: The golden hour after exercise is the first 60 minutes when refuelling best supports repair and glycogen replenishment; aim for 20 to 40 grams of protein, some carbs, and water or electrolytes.
Q: What should you do on rest days?
A: On rest days you should focus on light movement, sleep, nutrition, and recovery habits; try walking or mobility work, hydrate, eat protein-rich meals, and check morning HRV/RHR to guide the next session.